
A grant from the California Department of Parks and Recreation Natural Resources Division – Coastal Program (“Estuary Inlet Evolution & Dynamics”, January 2022-December 2022) extends work started from a prior grant (“Estuary Inlet Dynamics & Analysis”, July 2017- December 2021) in collaboration with Dr. Timu Gallien (UCLA, Coastal Flood Lab) to examine the interaction between estuary inlets and the adjacent beaches. The purpose of this research is to compare the complex, coupled beach-inlet morphological dynamics of two State Parks intermittently closed estuary mouths and provide output products useful to beach and estuary managers now and in the face of a changing climate. Inlet morphological response to climate change (i.e., sea level rise, changes in river discharge) and anthropogenic modification (e.g., manual breaching, altering upstream freshwater sources) are critical to understanding evolving coastal vulnerability. Coupled beach-estuary berm hydro-morphodynamic evolution is particularly important, directly modulating beach and estuarine hazards (e.g., erosion, coastal flooding, inlet closure, hypoxia), yet remain an active area of research due to their complexity limiting current predictive model skill. This new contract extends data collection begun under the prior contract, but also incorporates new analyses and collaborative aspects that expand the scope and impact of the work to include Northern California systems through a collaboration with Dr. Mara Orescanin (NPS, Coastal Dynamics Lab). Moreover, this second contract seeks to improve output products in anticipation of a more holistic analysis of the results, geared towards managerial needs in future years.
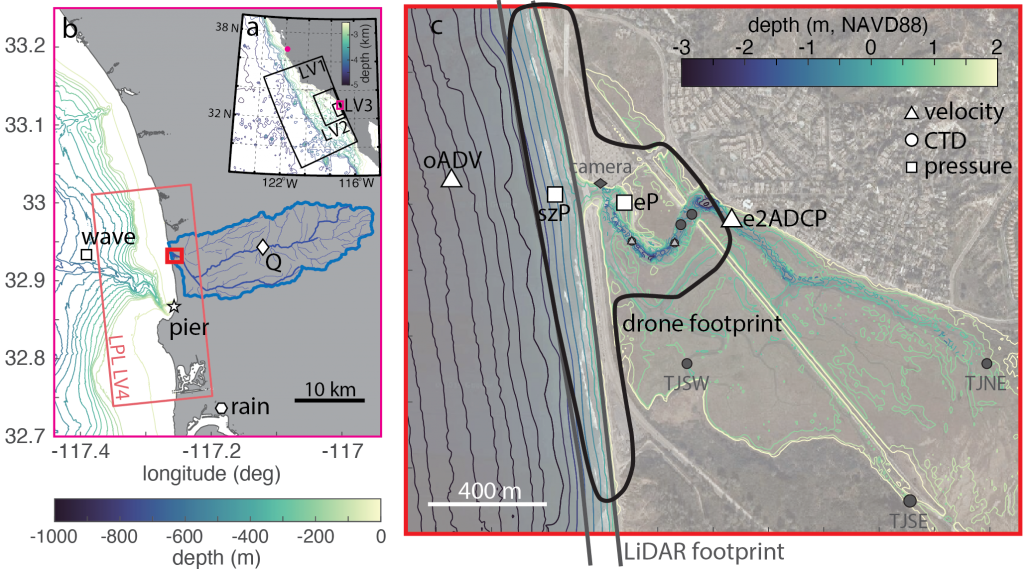
Figure 1. (a) California/Baja map with regional Los Peñasquitos Lagoon area shown in (b) outlined in pink and model parent grids (LV1-LV3) outlined in black. The Pajaro Lagoon location is shown with a pink dot north of the LV1 boundary. (b) Regional map with field locations of publicly available data overlain and the LPL LV4 model domain outlined in light red. Darker red box outlines the region shown in panel c. (c) Torrey Pines/Los Peñasquitos Lagoon bathymetry and instrument locations. Large white symbols indicate instrumentation that has been maintained as part of this project. Dark gray symbols indicate instrumentation maintained by the Tijuana River National Estuarine Research Reserve. Small gray symbols indicate locations previously occupied under prior Parks contracts. Note that both velocity (triangle) and Conductivity Temperature Depth (CTD, circle) locations also include pressure sensors (a square indicates a standalone pressure sensor). The UAV footprint is outlined in black and the LiDAR footprint is outlined in dark gray and extends beyond panel c by ~400m to the north and south.

Figure 2. Pajaro Valley map. Map of the Pajaro Lagoon, river, and upstream freshwater management system managed by the PVWMA. The yellow dashed lines represent broad surface water pathways between upstream, lagoon, and the ocean (thin blue lines show actual freshwater pathways including tributaries). White dots represent water management locations and diversions. The location of this map is indicated on Figure 1a.
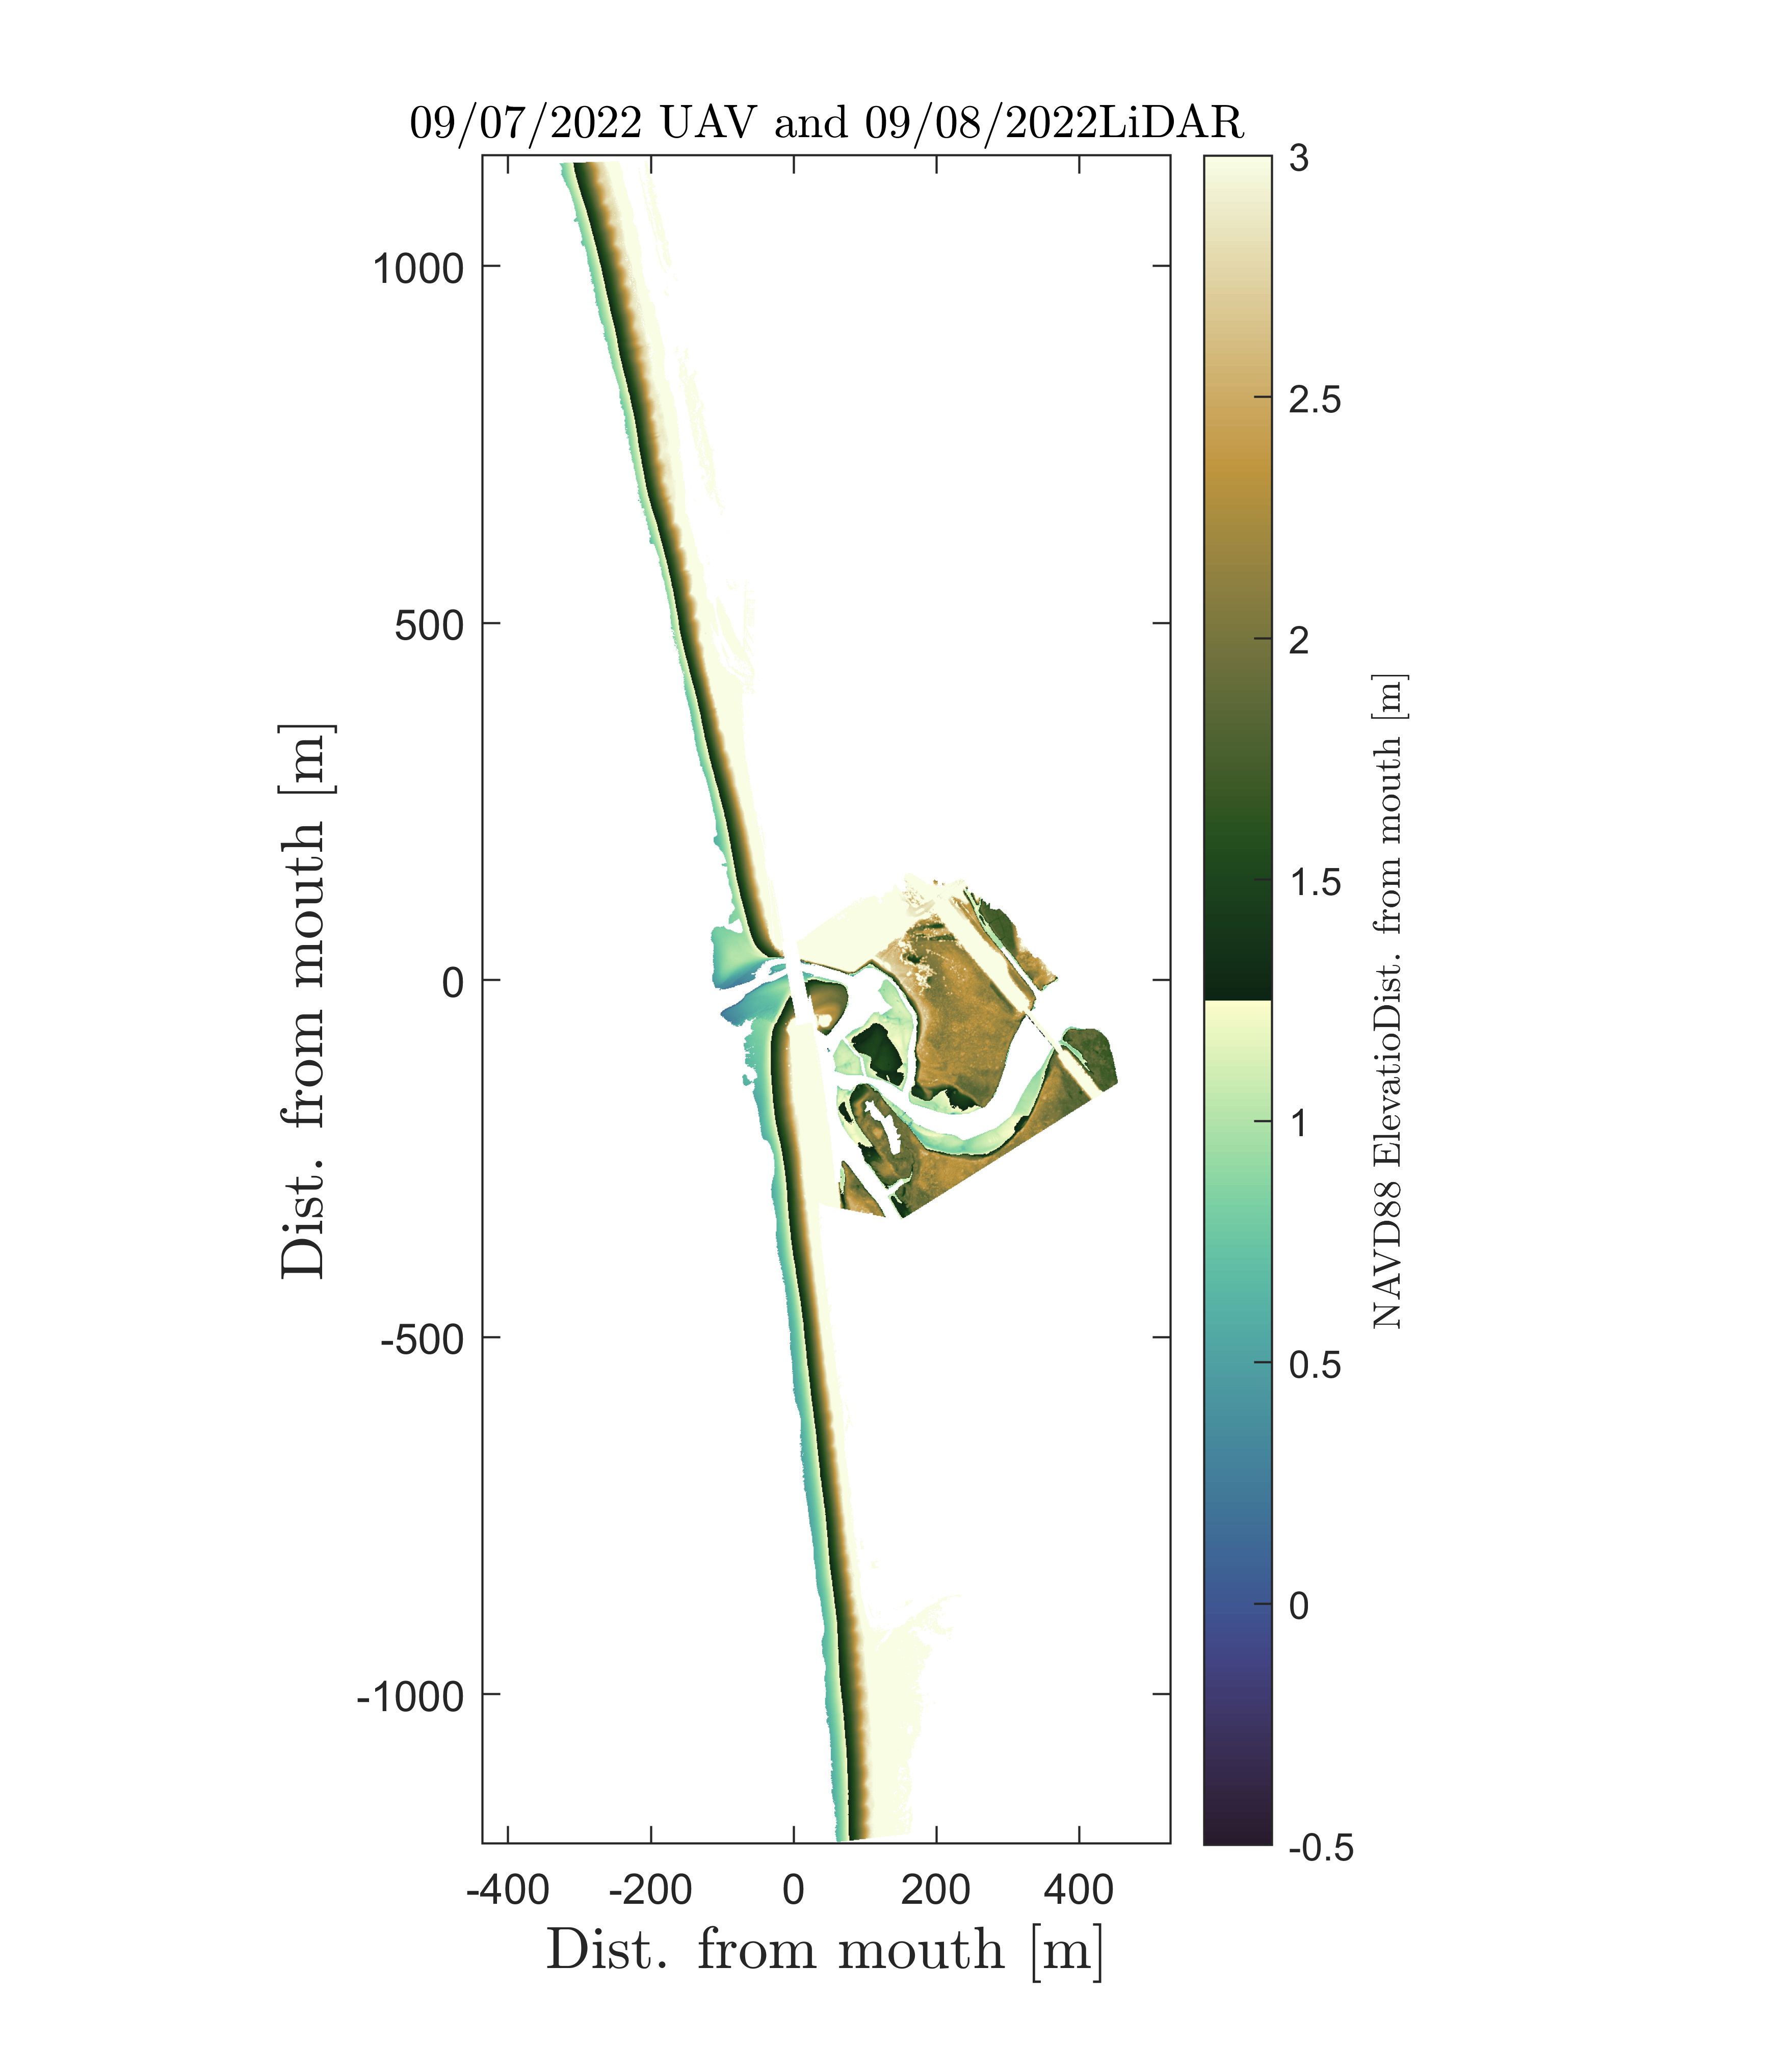
Comparison between UAV and LiDAR topo/bathymetry shows very strong agreement between these methodologies and suggests optimal future sampling schemes. Figure 3 shows the full extent and data from each survey type on the upper panels and difference maps on the lower panels. The drone is able to capture inside the estuary mouth while the LiDAR can capture a longer stretch of beach, but without any data upstream of the HW1 bridge, i.e., upstream of the mouth. The Jumbo surveys are able to cover a similar along-beach extent as the LiDAR with the benefit of extending deeper into the water (because of the jetski ability to capture sub-tidal), however with a drawback of significantly coarser spatial resolution and significantly more person-hours and resources. Differences between the UAV and LiDAR versus the jumbo can be as high as 0.3 m because these were not taken concurrently and thus likely include real morphodynamic change (Figure 3). Differences between the UAV and LiDAR taken concurrently however are typically less than 3 cm except for the pixel right next to the highway bridge (Figure 4). This suggests very strong agreement between the UAV and LiDAR methodologies. It also suggests that an optimal sampling scheme would survey the beach using LiDAR (longer along-beach extent) and the estuary upstream of its mouth using UAV and then stitching them together. Additional testing of this occurred during this award comparing a UAV flight on 30 March 2022 and a LiDAR survey on 31 March 2022. Because these were 1 day apart, differences up to 0.1m were observed, which are well within possible sediment elevation changes over a daily timescale. We also compared a smaller domain near the estuary mouth from a UAV flight and LiDAR survey both collected on 20 December 2022 with most differences less than 3cm as seen on Figure 4, thus confirming that these two methodologies compare well.

Figure 3. Drone/LiDAR/jumbo comparison. Comparisons between drone (a) and LiDAR (b) data collected on 01 Jan 2020 and jumbo survey (c) data collected on 17 Dec 2019 (under prior contract C1670005). Data show the mean value within a given calculation grid. These images also show the full spatial range of each data type. Note that the data in (a) – (c) are in meters relative to mean sea level (MSL) but the color scale changes from blues to browns at mean higher high water (MHHW). The color scales on the difference maps range from -0.3 to 0.3 m, i.e., 30 cm differences.
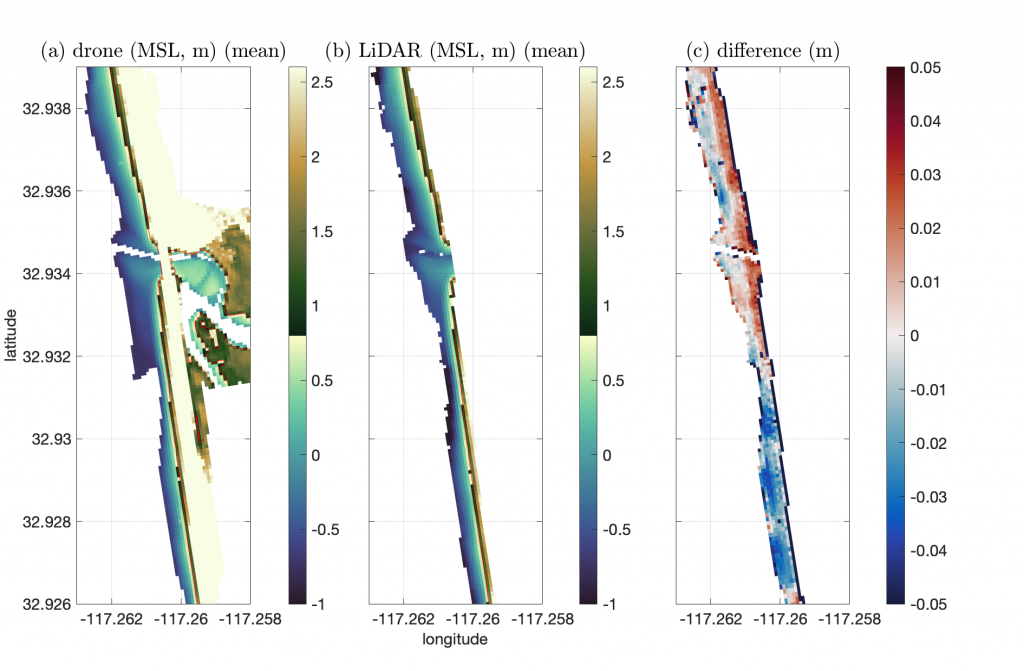
Figure 4. Drone/LiDAR beach comparison. Comparisons between drone (a) and LiDAR (b) data collected on 01 Jan 2020. Note that the data in (a) and (b) are in meters relative to mean sea level (MSL) but the color scale changes from blues to browns at mean higher high water (MHHW). (c) difference (meters) between the LiDAR and the drone where values >0 indicate the LiDAR reports higher elevation. Note the scale ranges from -0.05 to 0.05 m and at most locations the LiDAR and drone elevation are within 0.03 m, i.e., 3 cm from each other.
In addition to comparing collection platforms, we have also worked on creating improved difference maps and new algorithms for water detection. Postdoctoral scholar, Dr. Alexandra Simpson tested several automatic water-detection algorithms including image segmentation based on classification using k-means and based on elevation. K-mean classification groups pixels into clusters based on similarity of pixel values, here the user can adjust the number of clusters. In some cases k-mean classification worked well, however in other cases a combination of k-mean classification plus an elevation cutoff was ideal, and in some cases, neither approach completely removed all water pixels. Ultimately we decided that a modified semi-automatic water-detection algorithm that includes automatic water-detection with both k-mean classification and elevation cutoffs, followed by manual editing is optimal. An example difference map using this semi-automatic water-detection algorithm and improved difference mapping is in Figure 5.
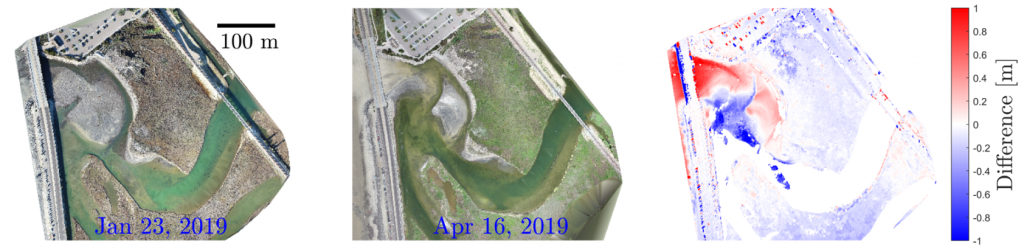
Figure 5. UAV/LiDAR difference map. RGB images from UAV flights on 23 Jan (left) and 16 April 2019 (middle) are differenced to show the elevation change (right). The final difference map includes large (> 1m) accretion and erosion near the mouth. These patterns integrate over several significant morphological changes during the 3-month period between the images including a short mouth closure in late January followed by a large rainfall and subsequent erosion event at the end of February, and then a mouth closure that occurred in mid April just before the second UAV flight.
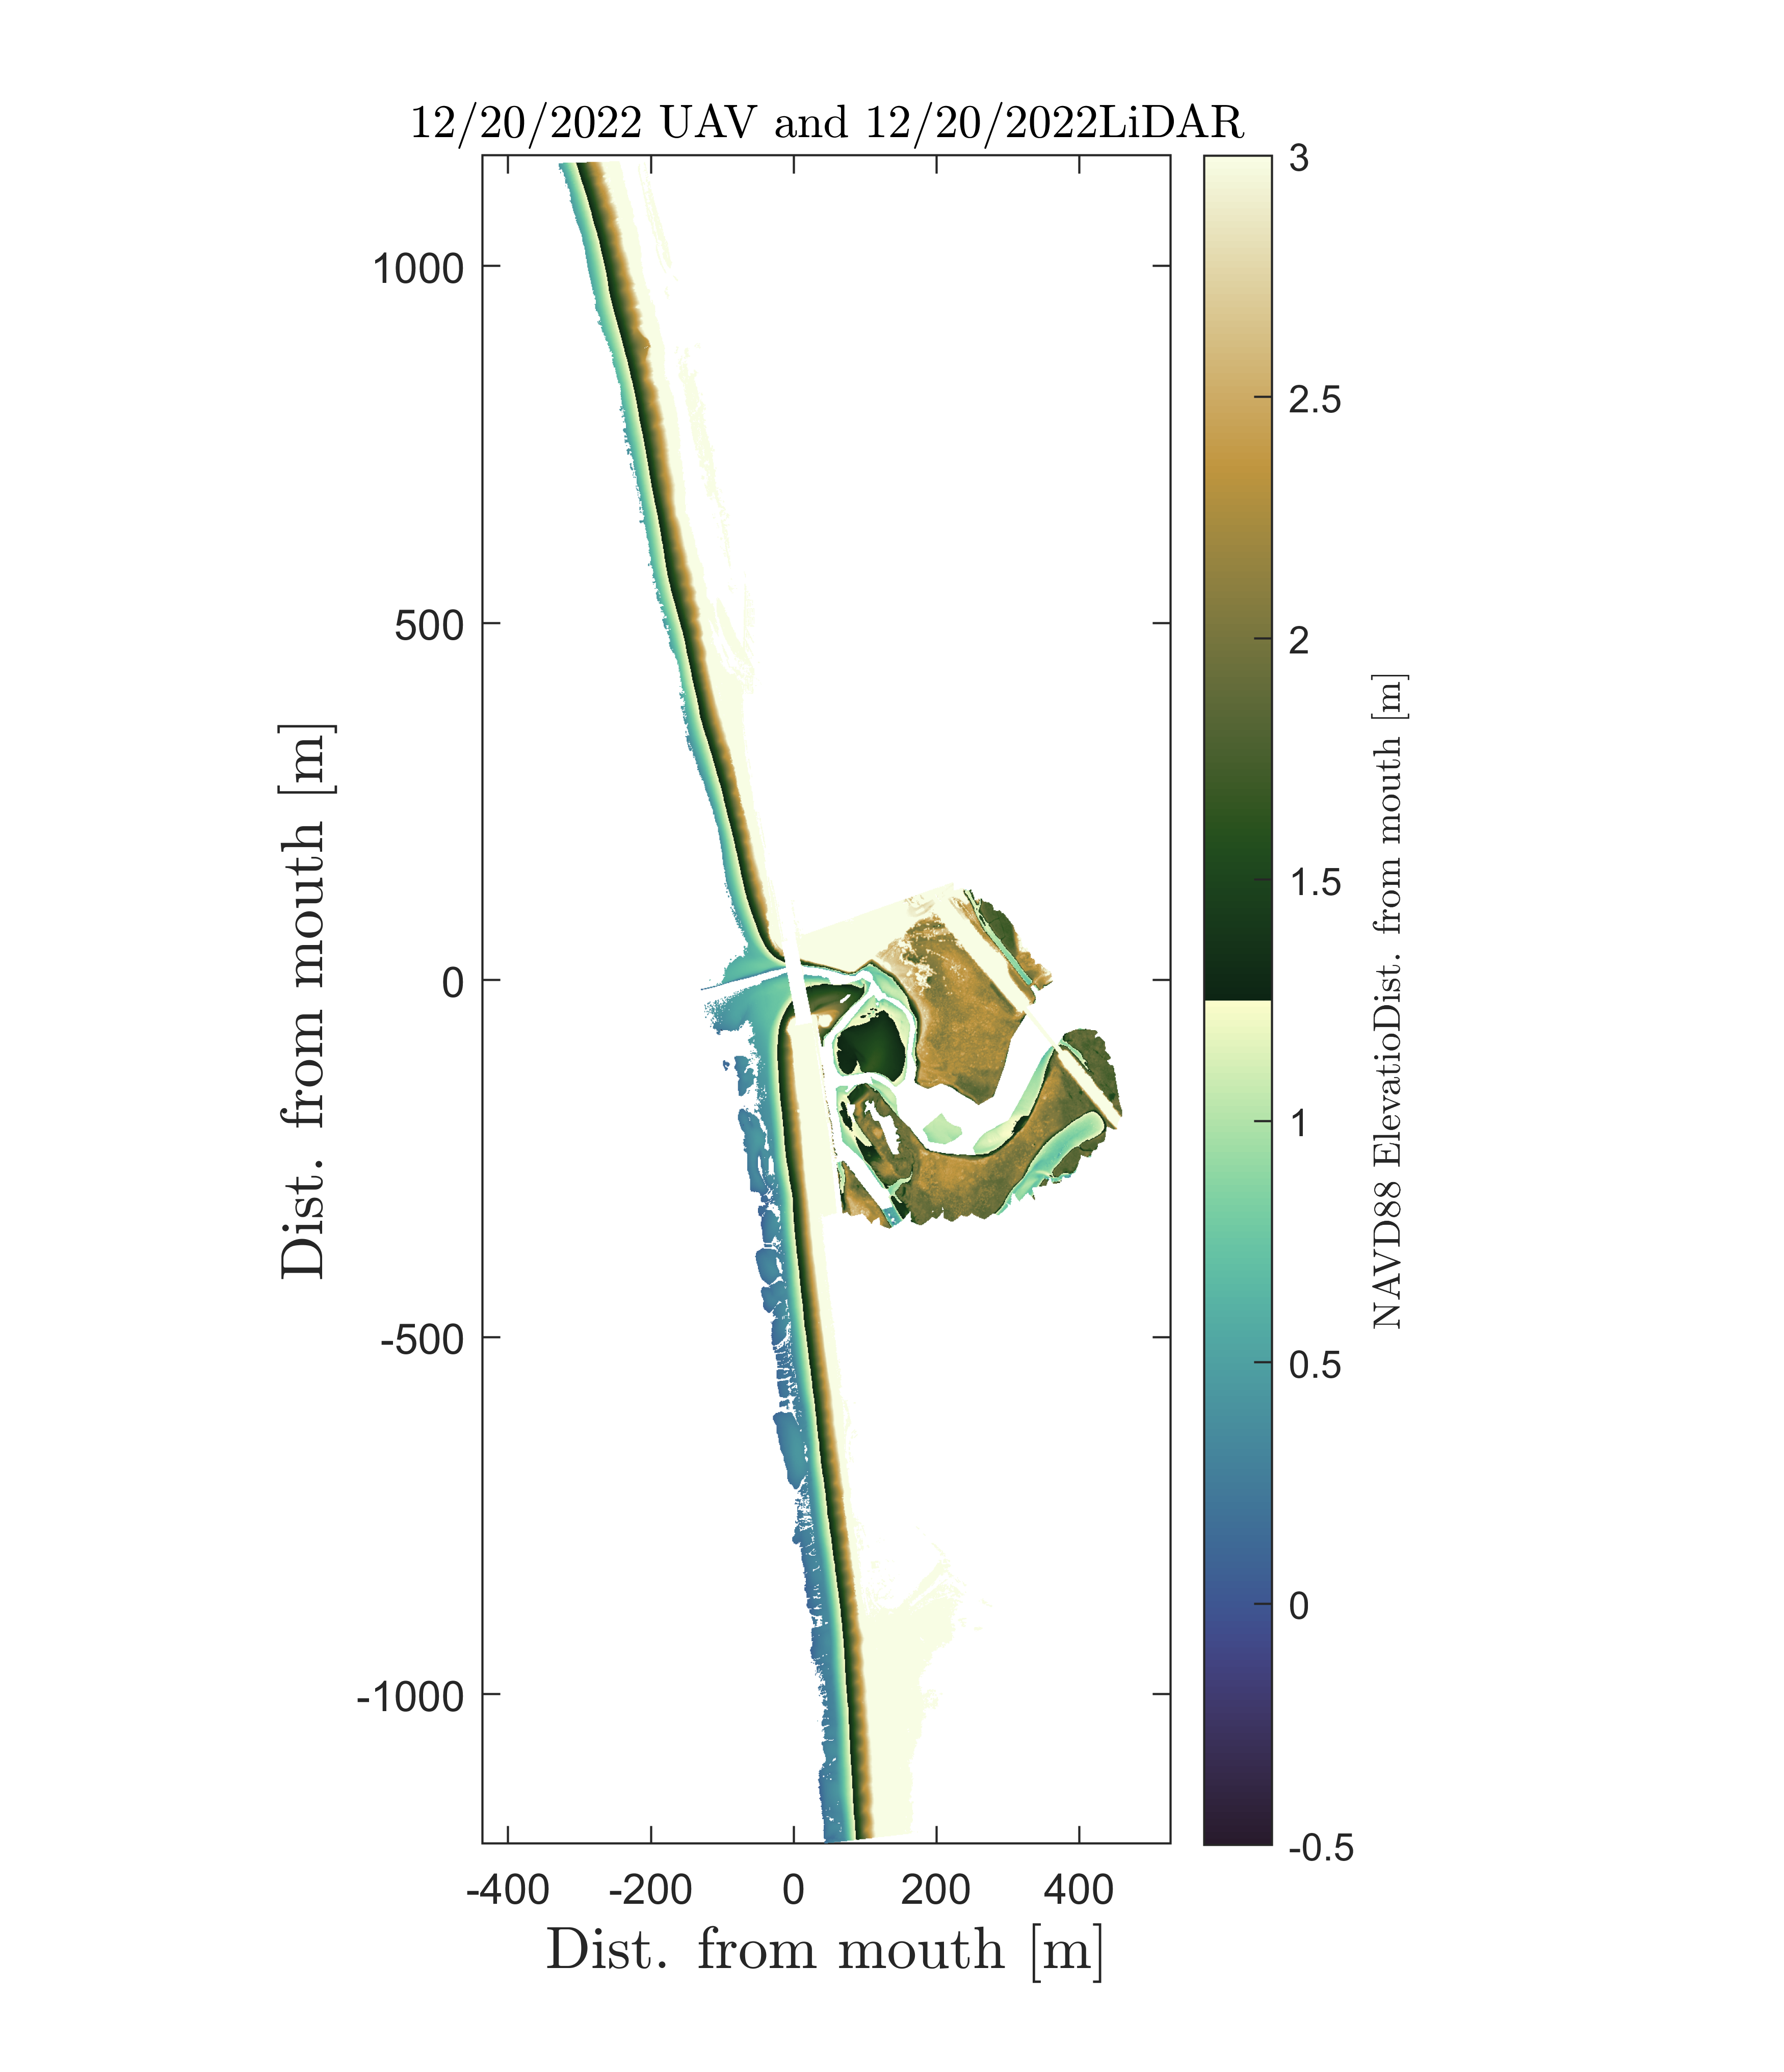
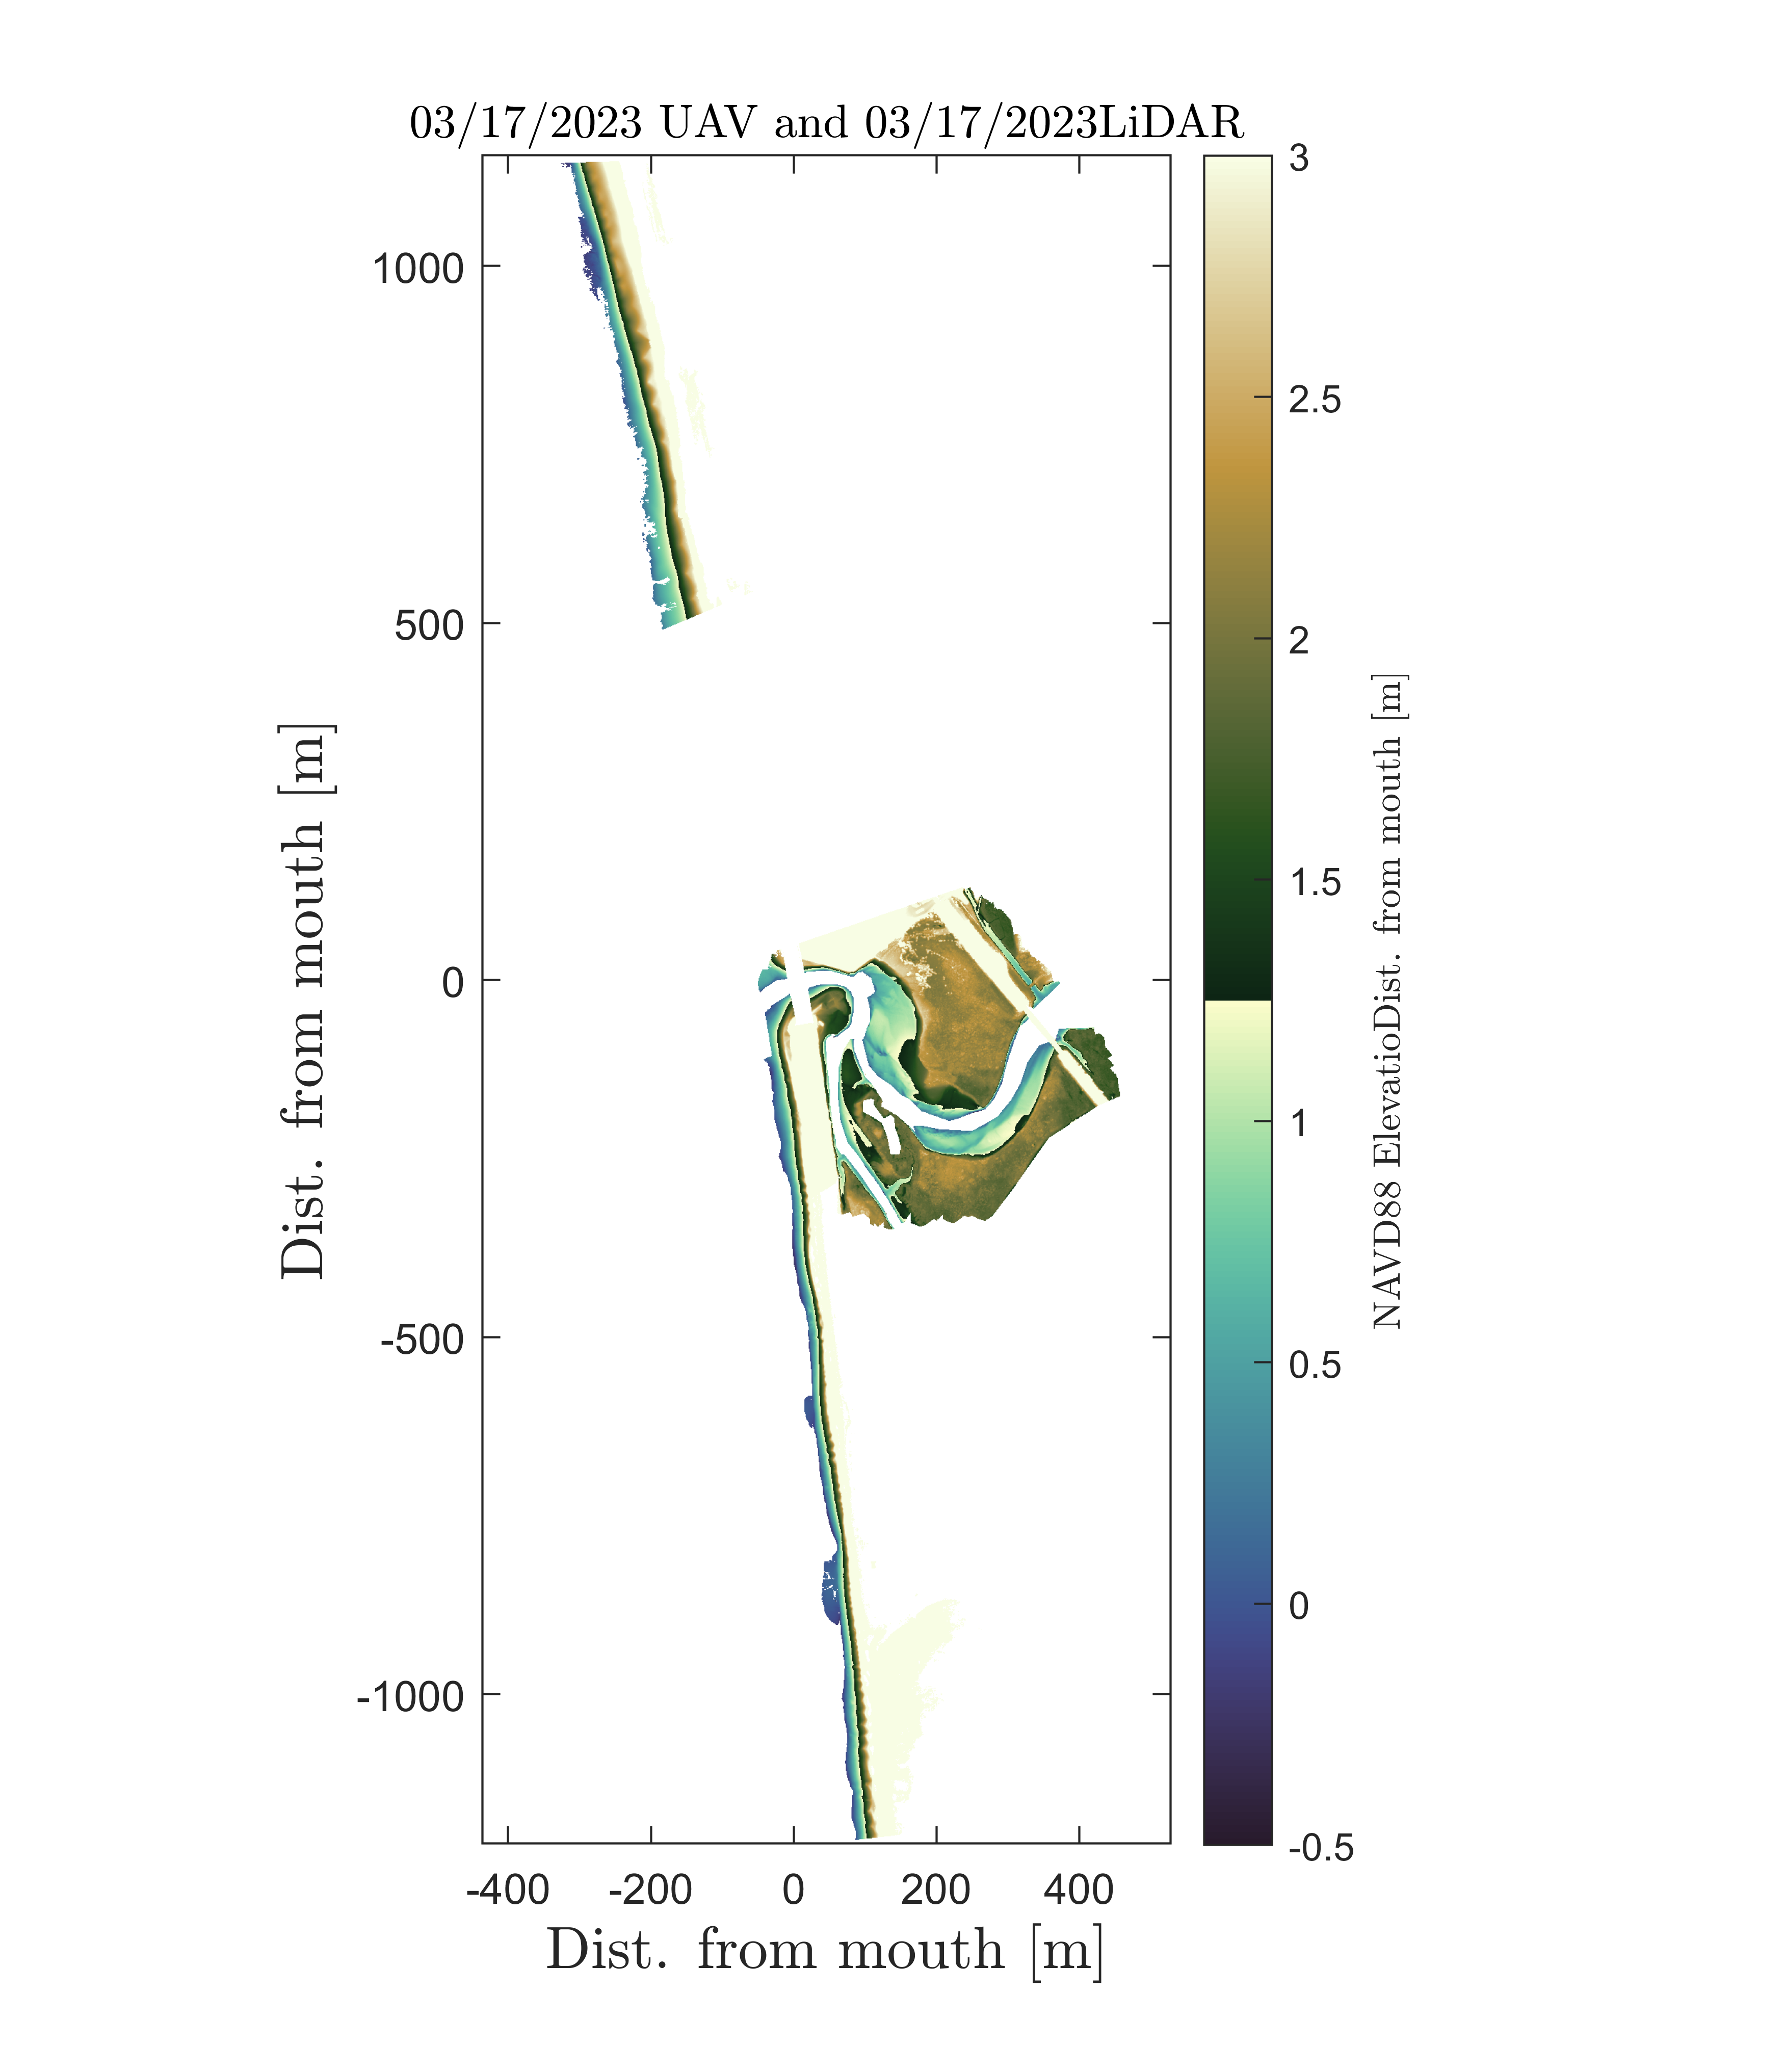
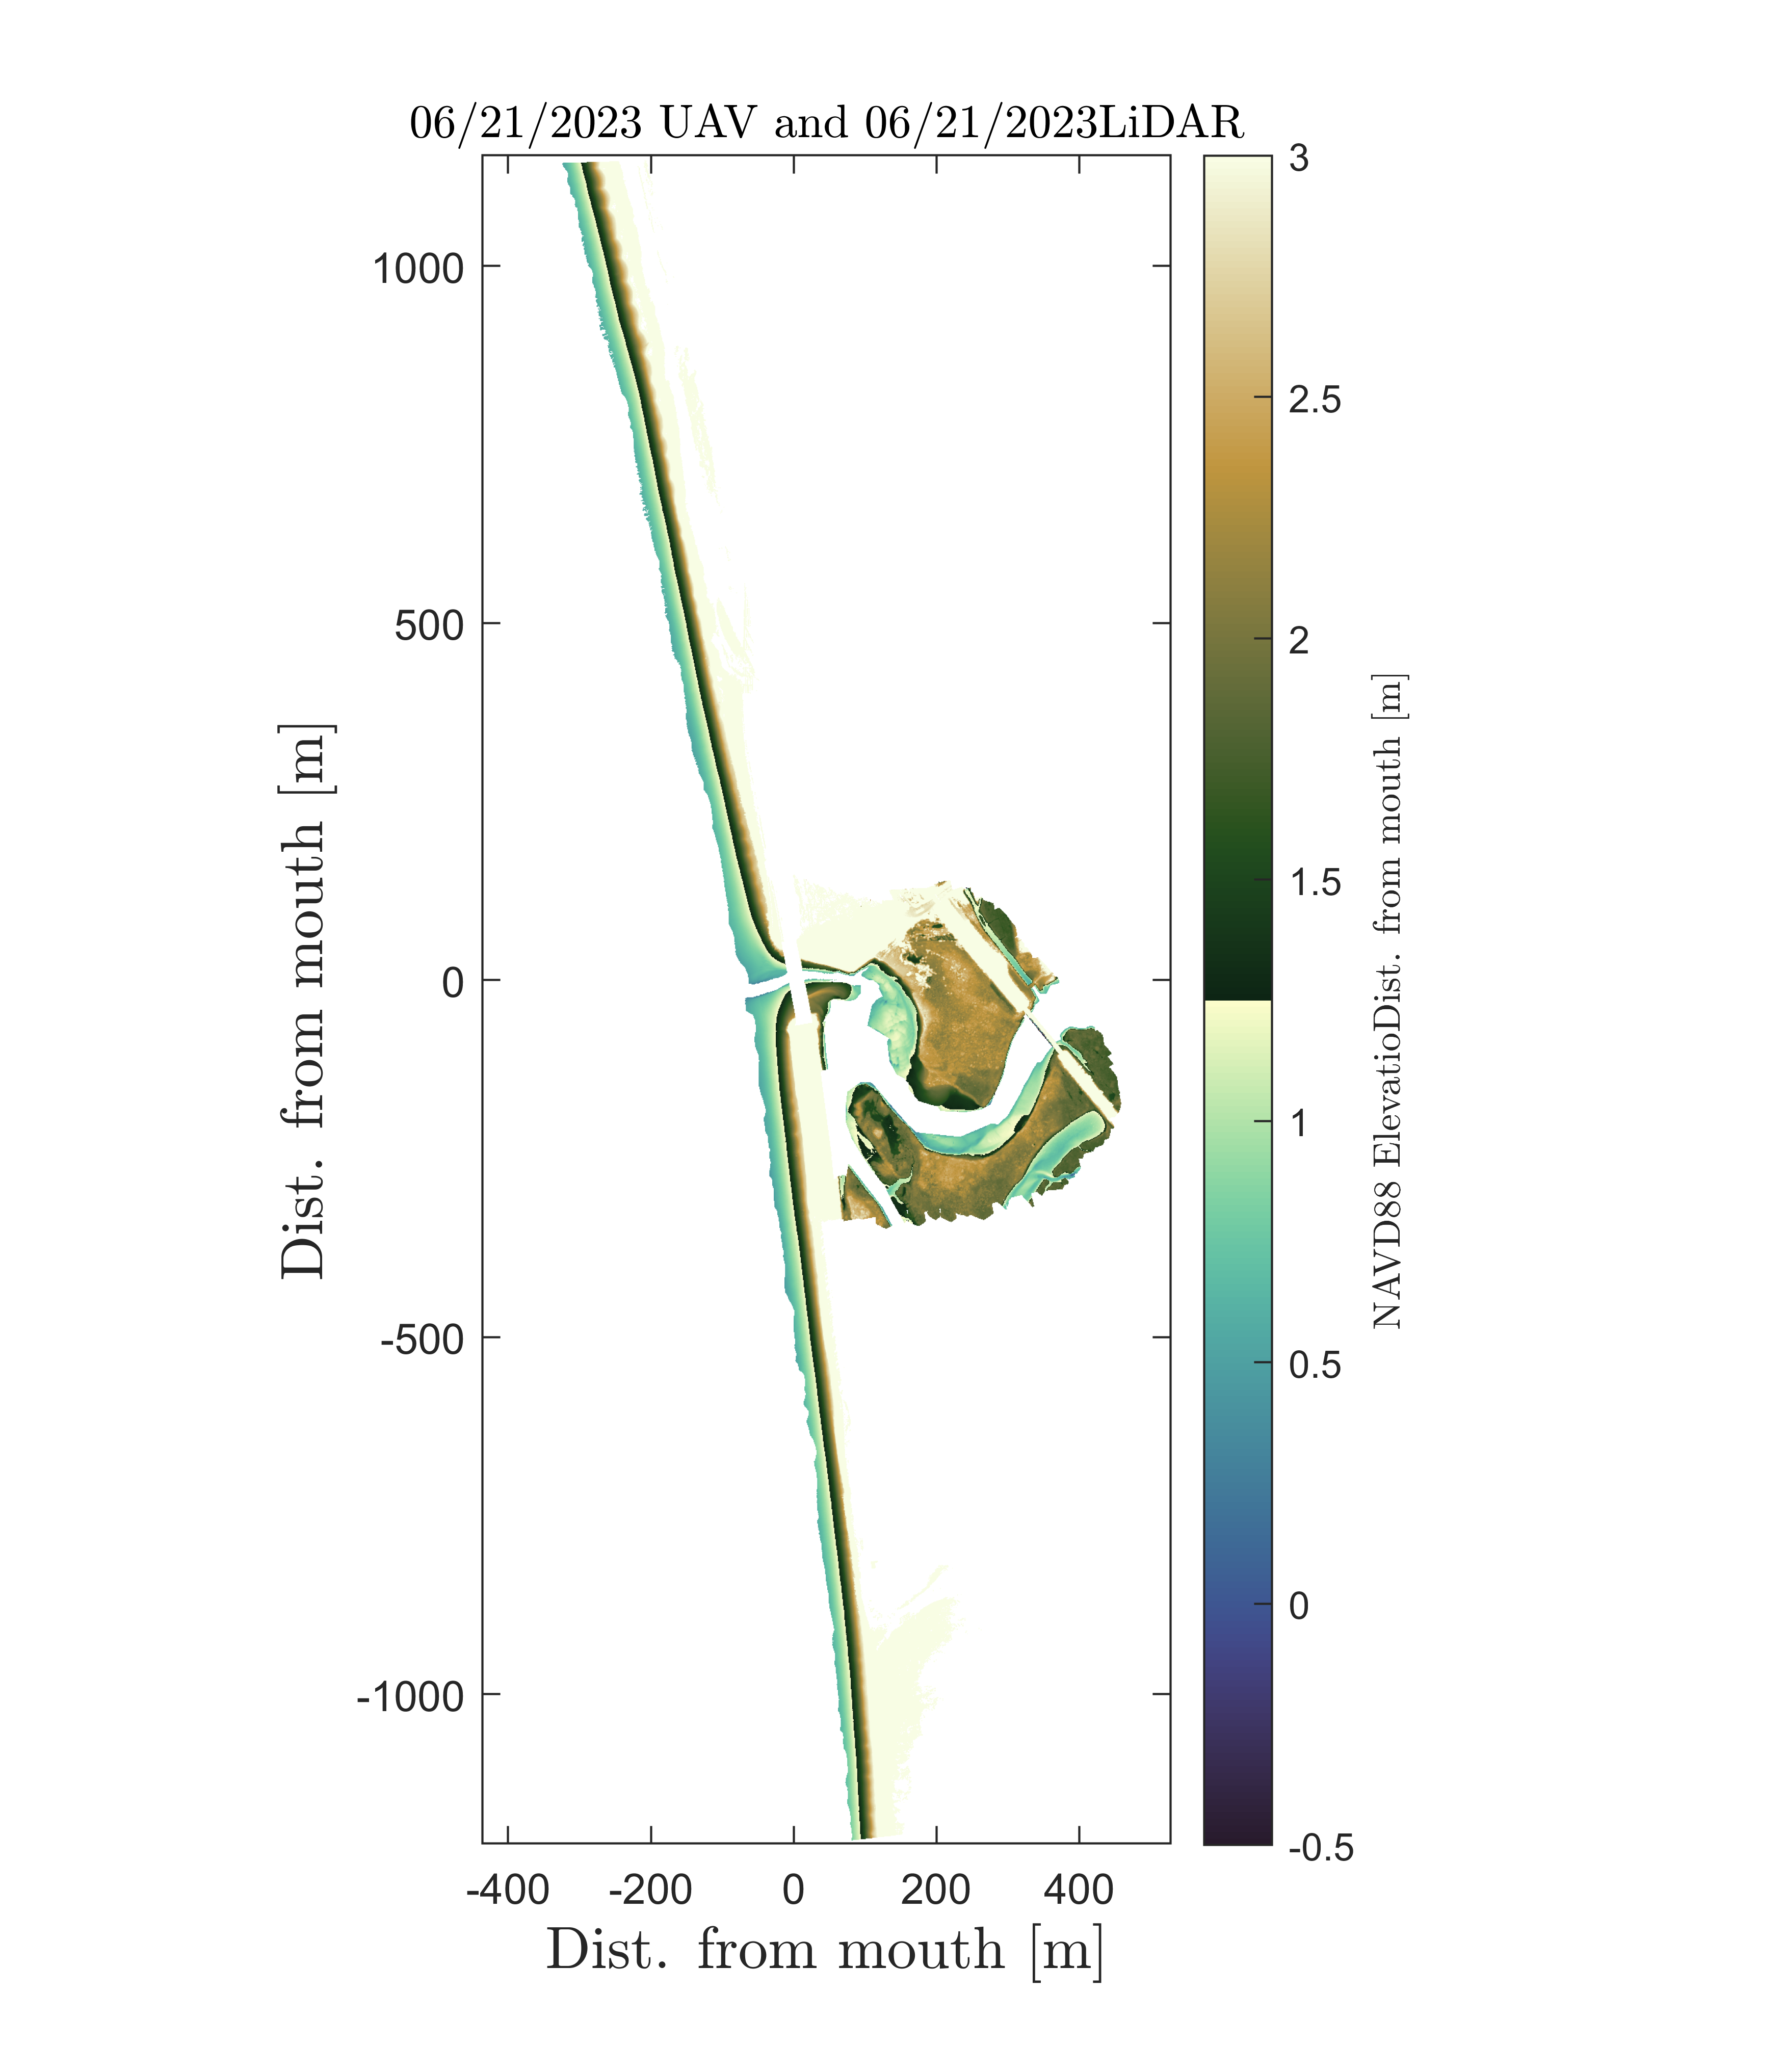
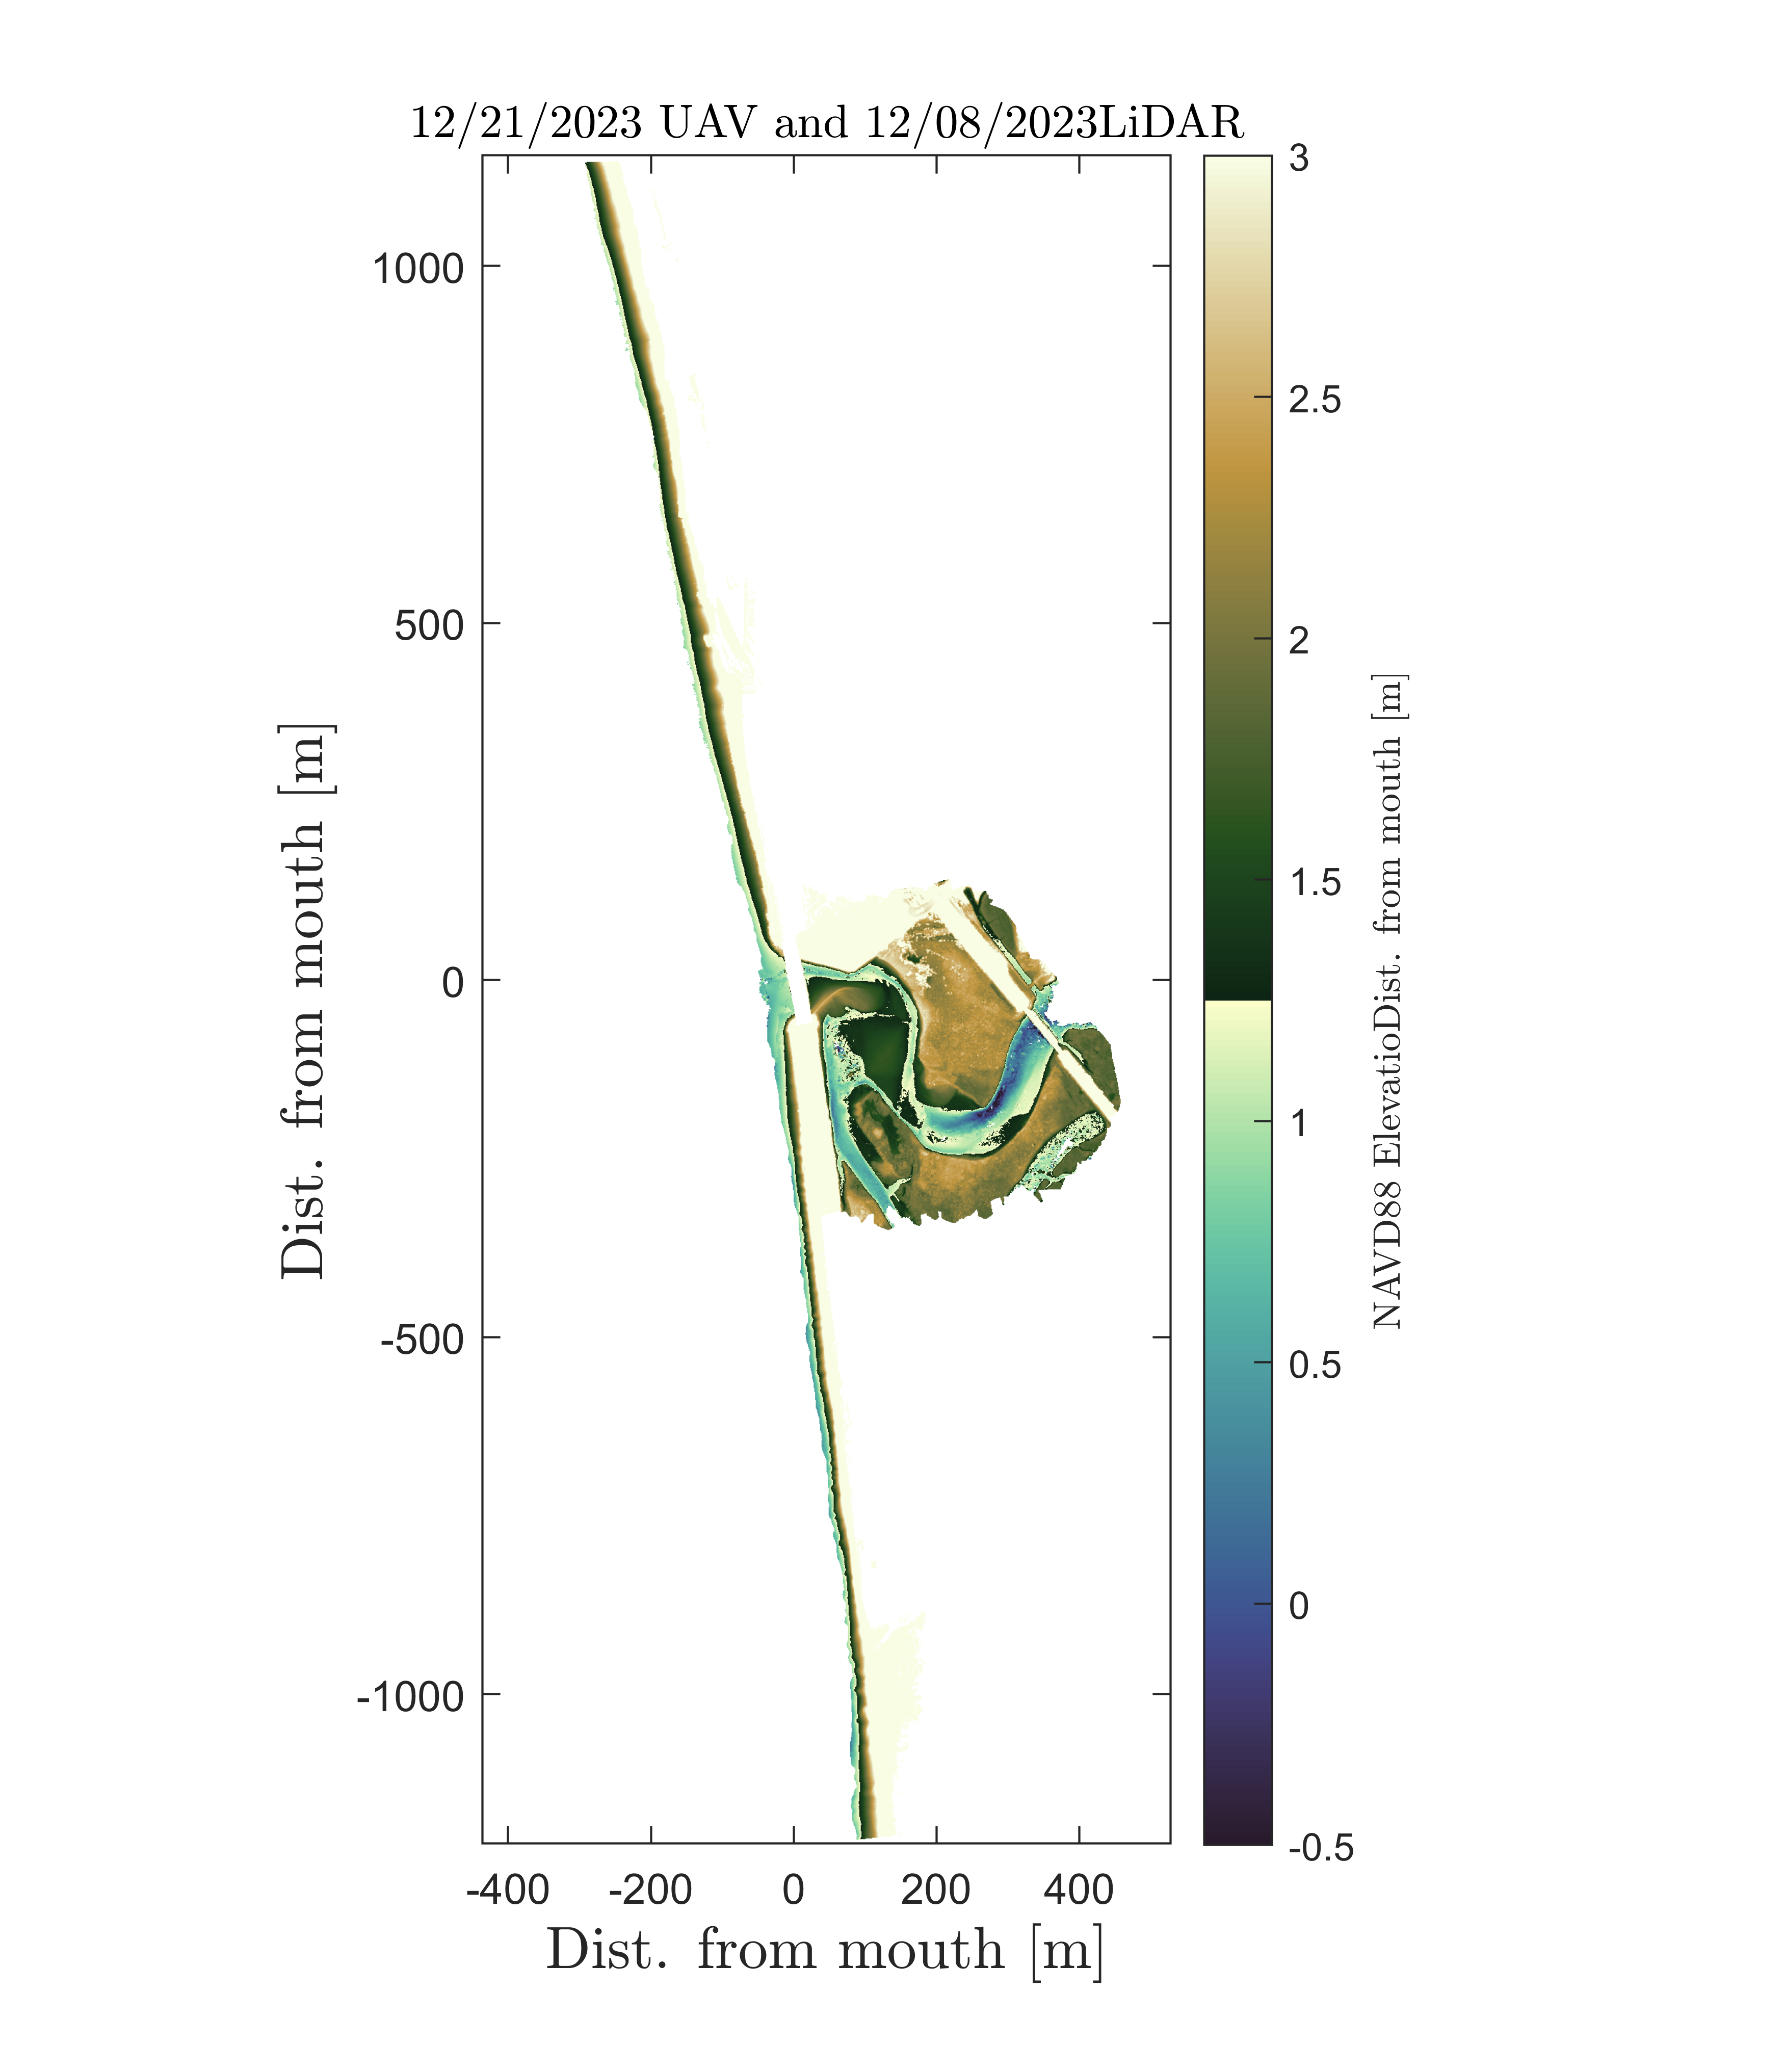
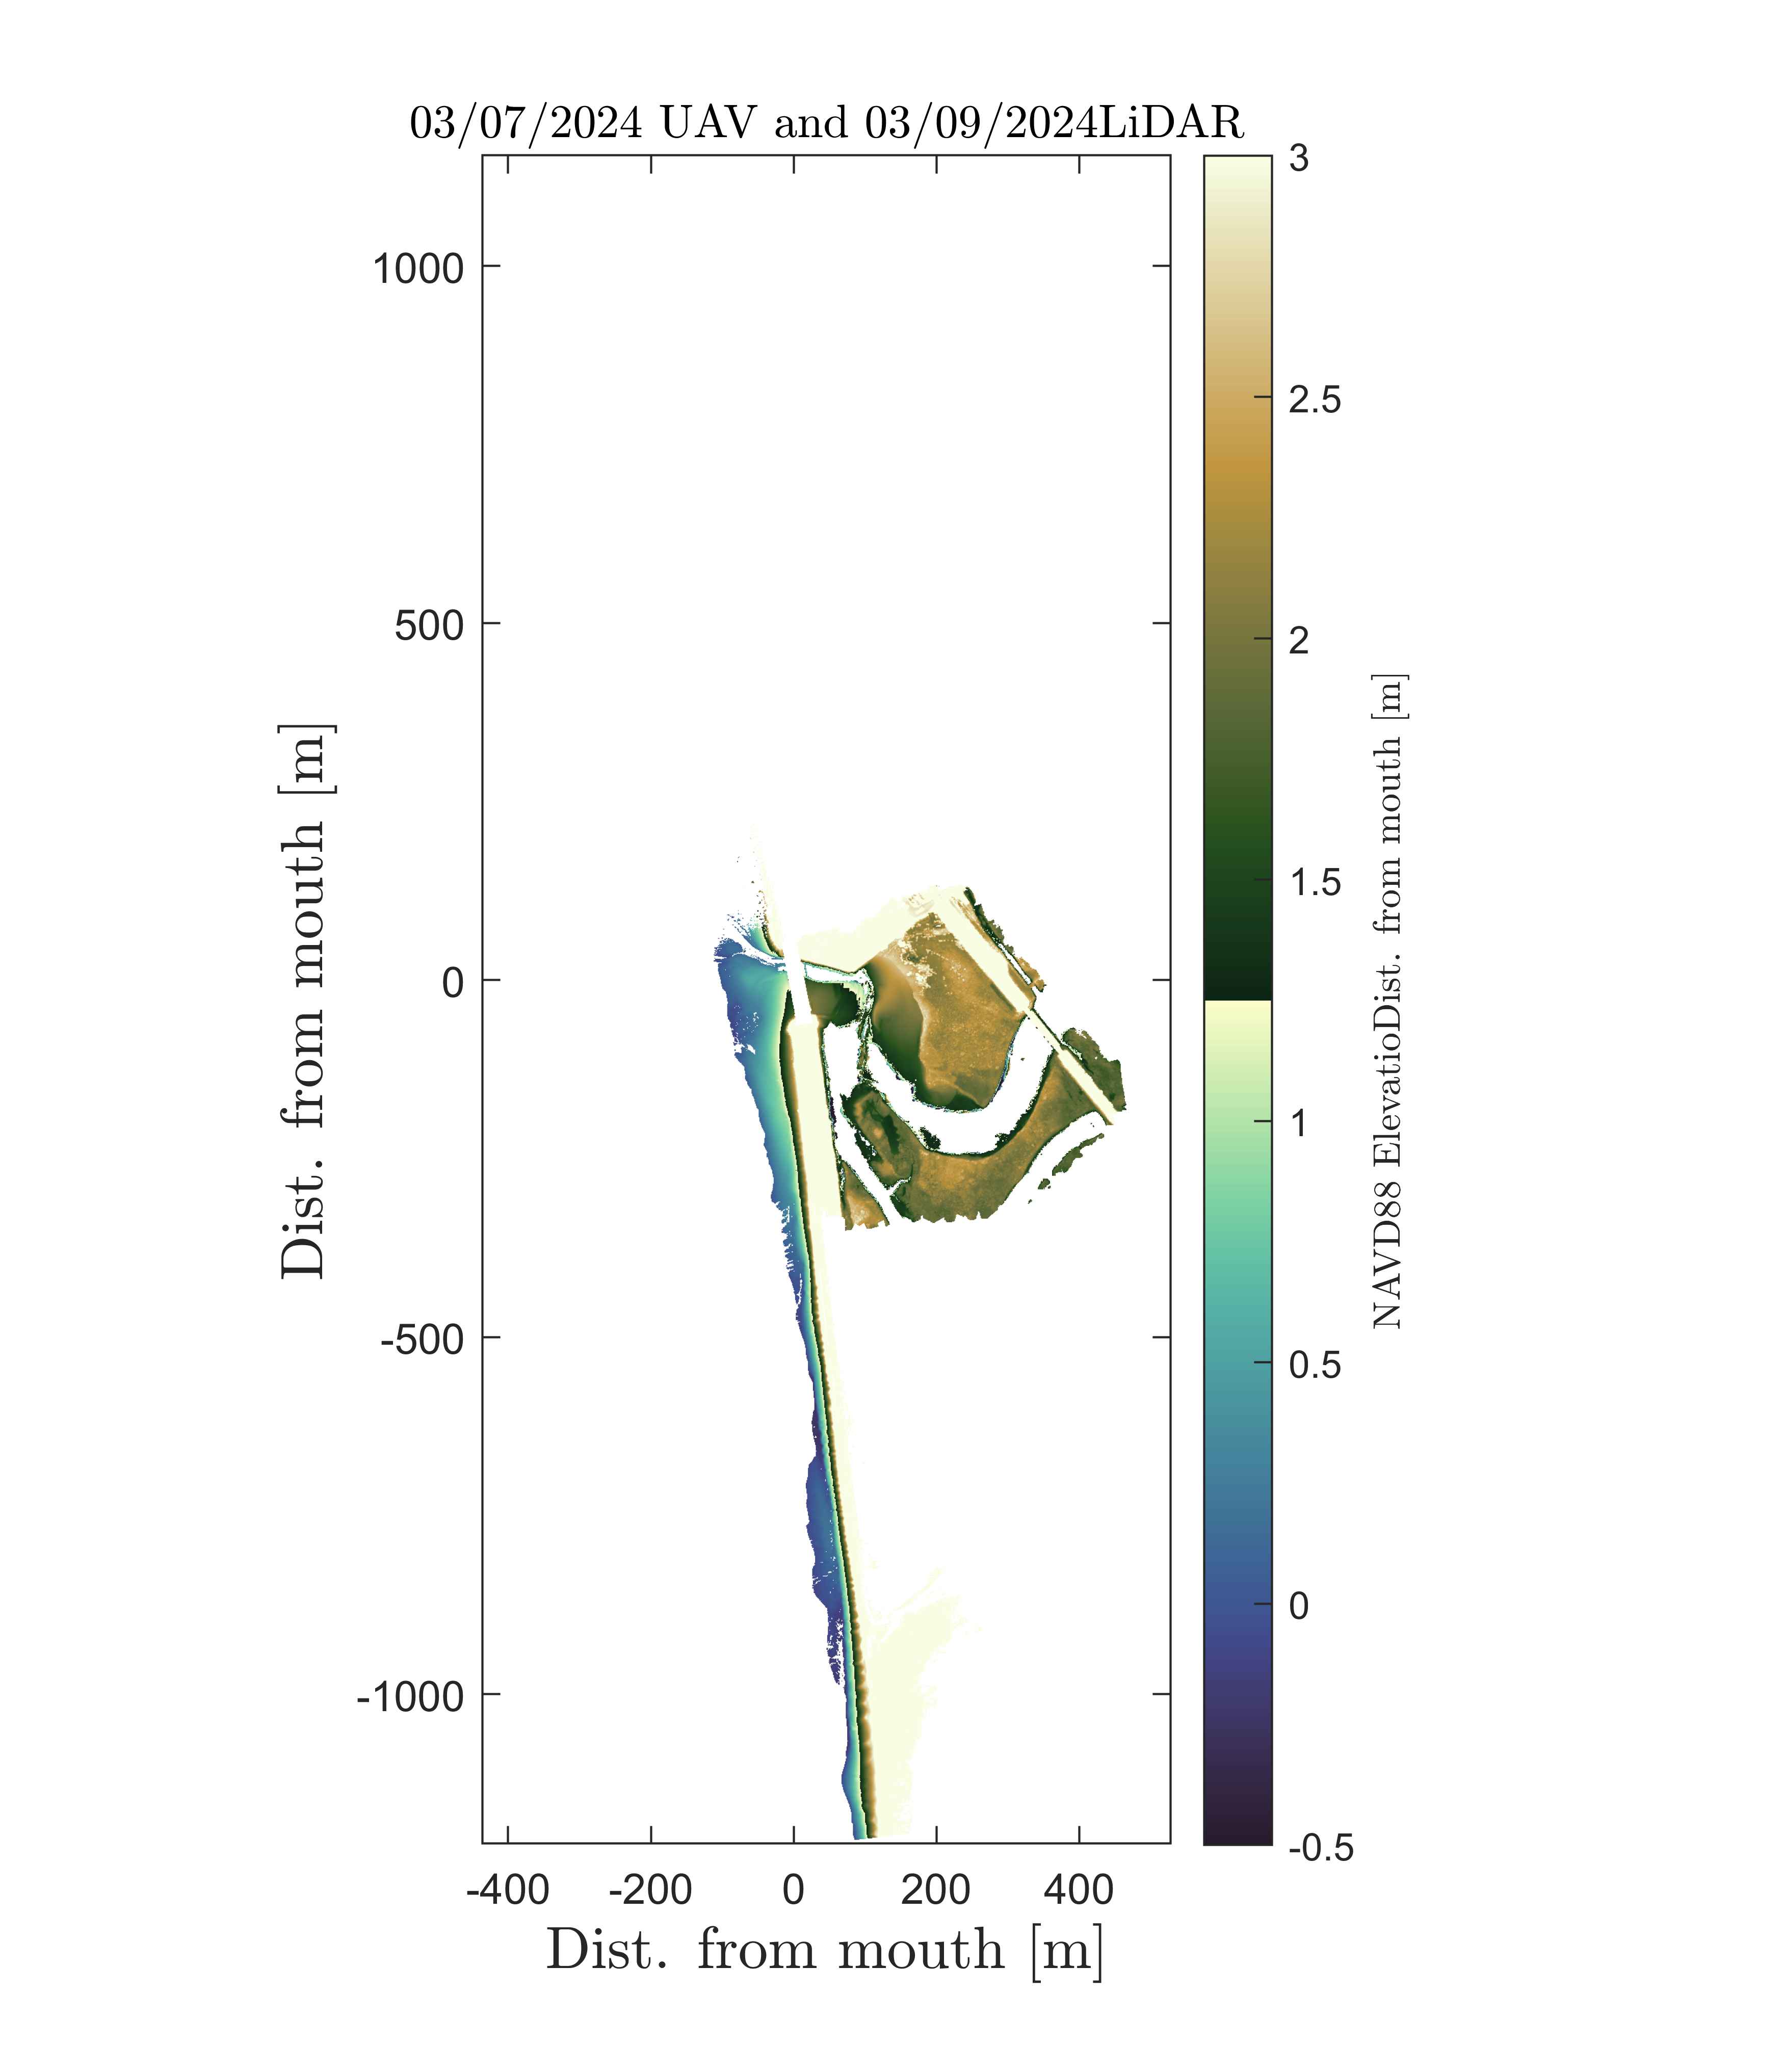
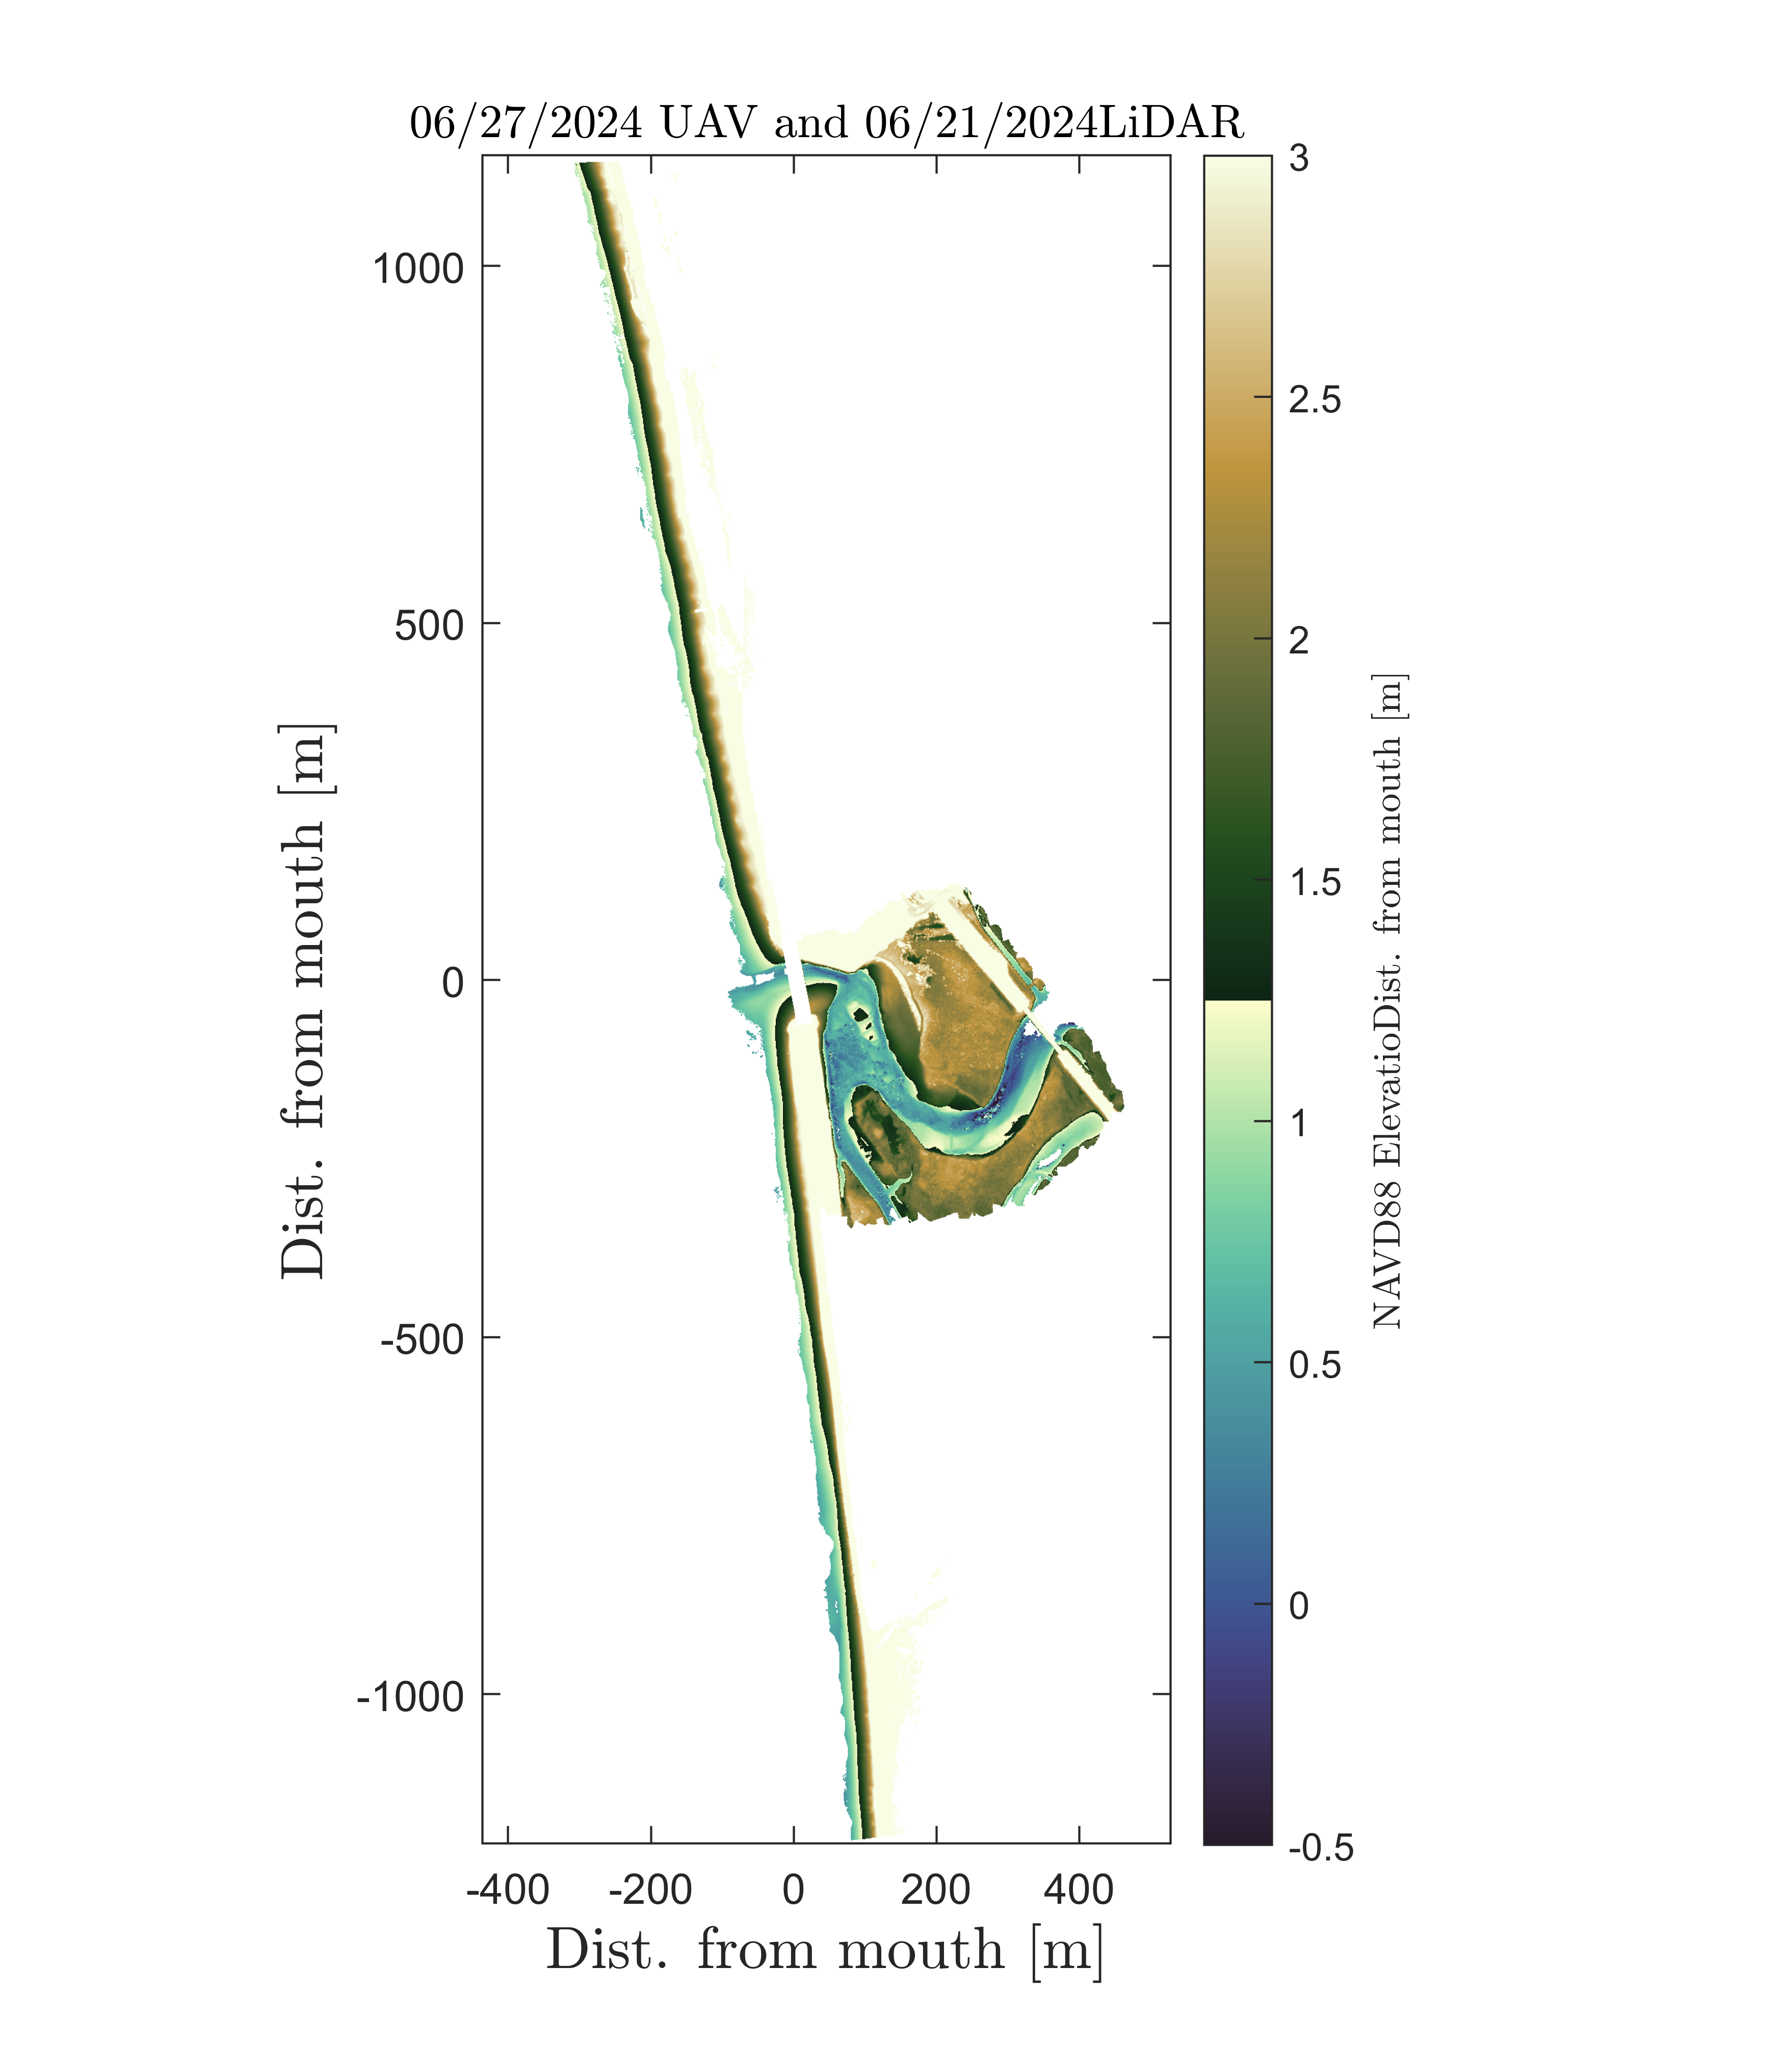
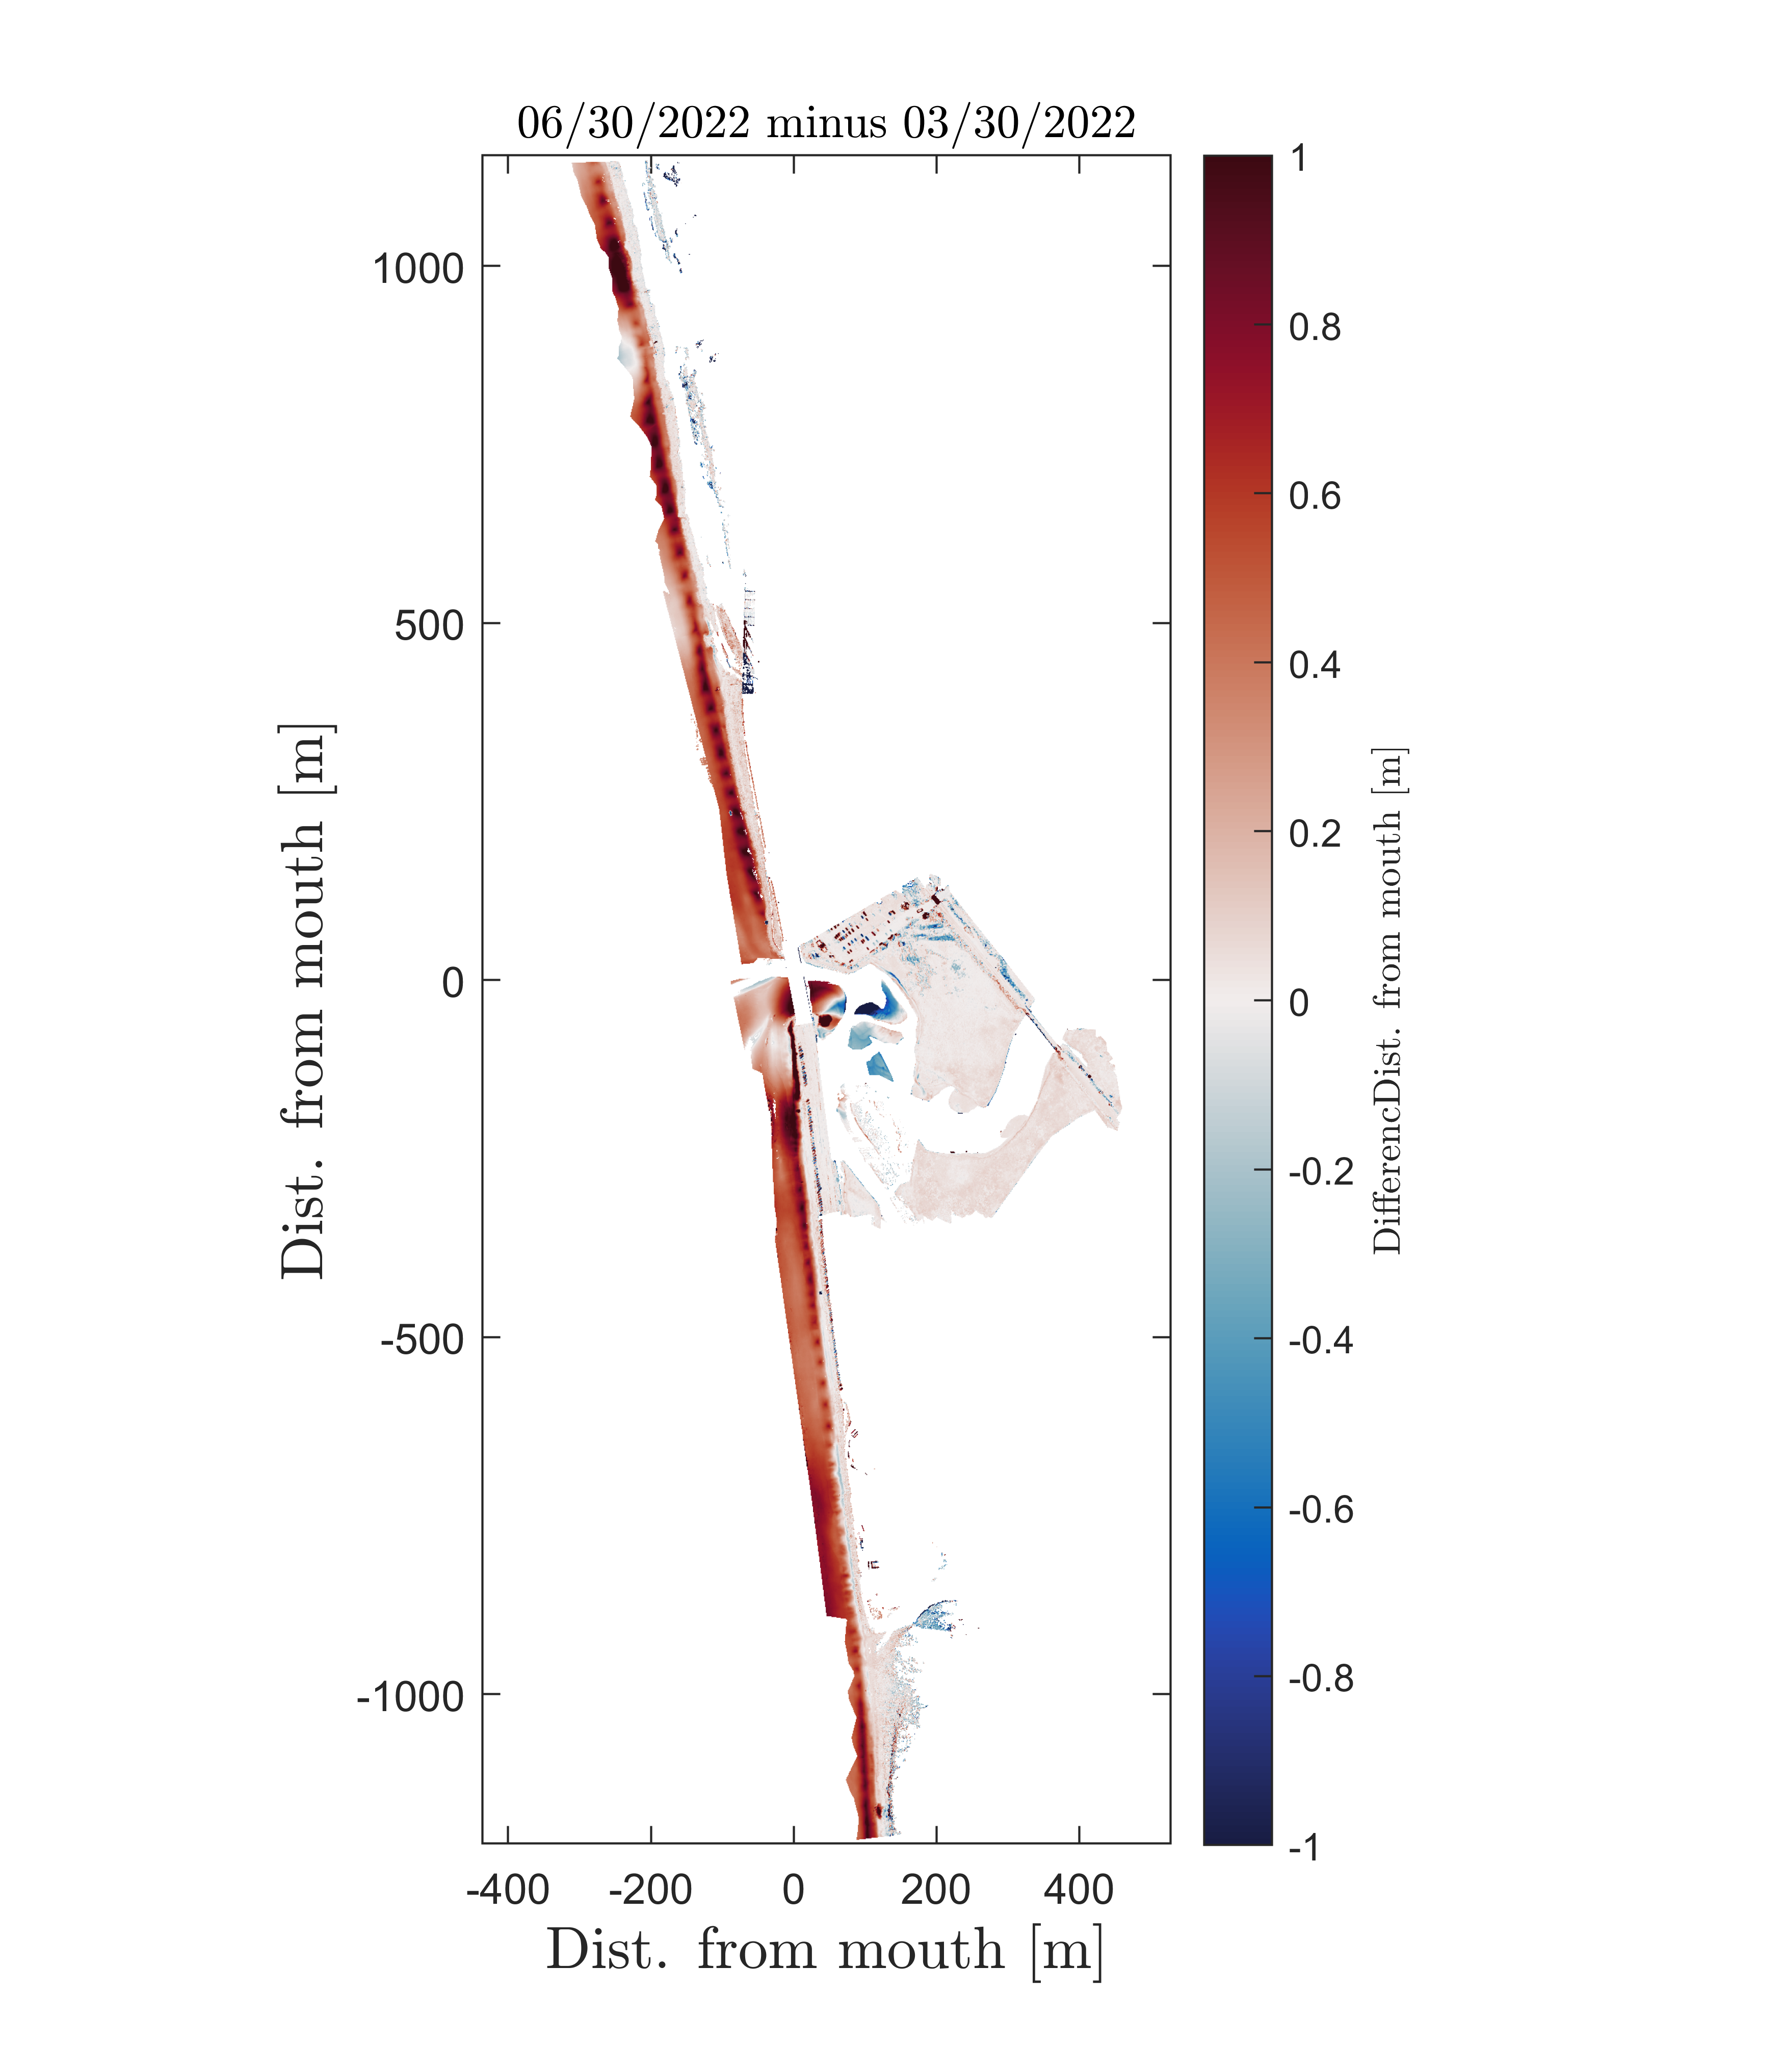
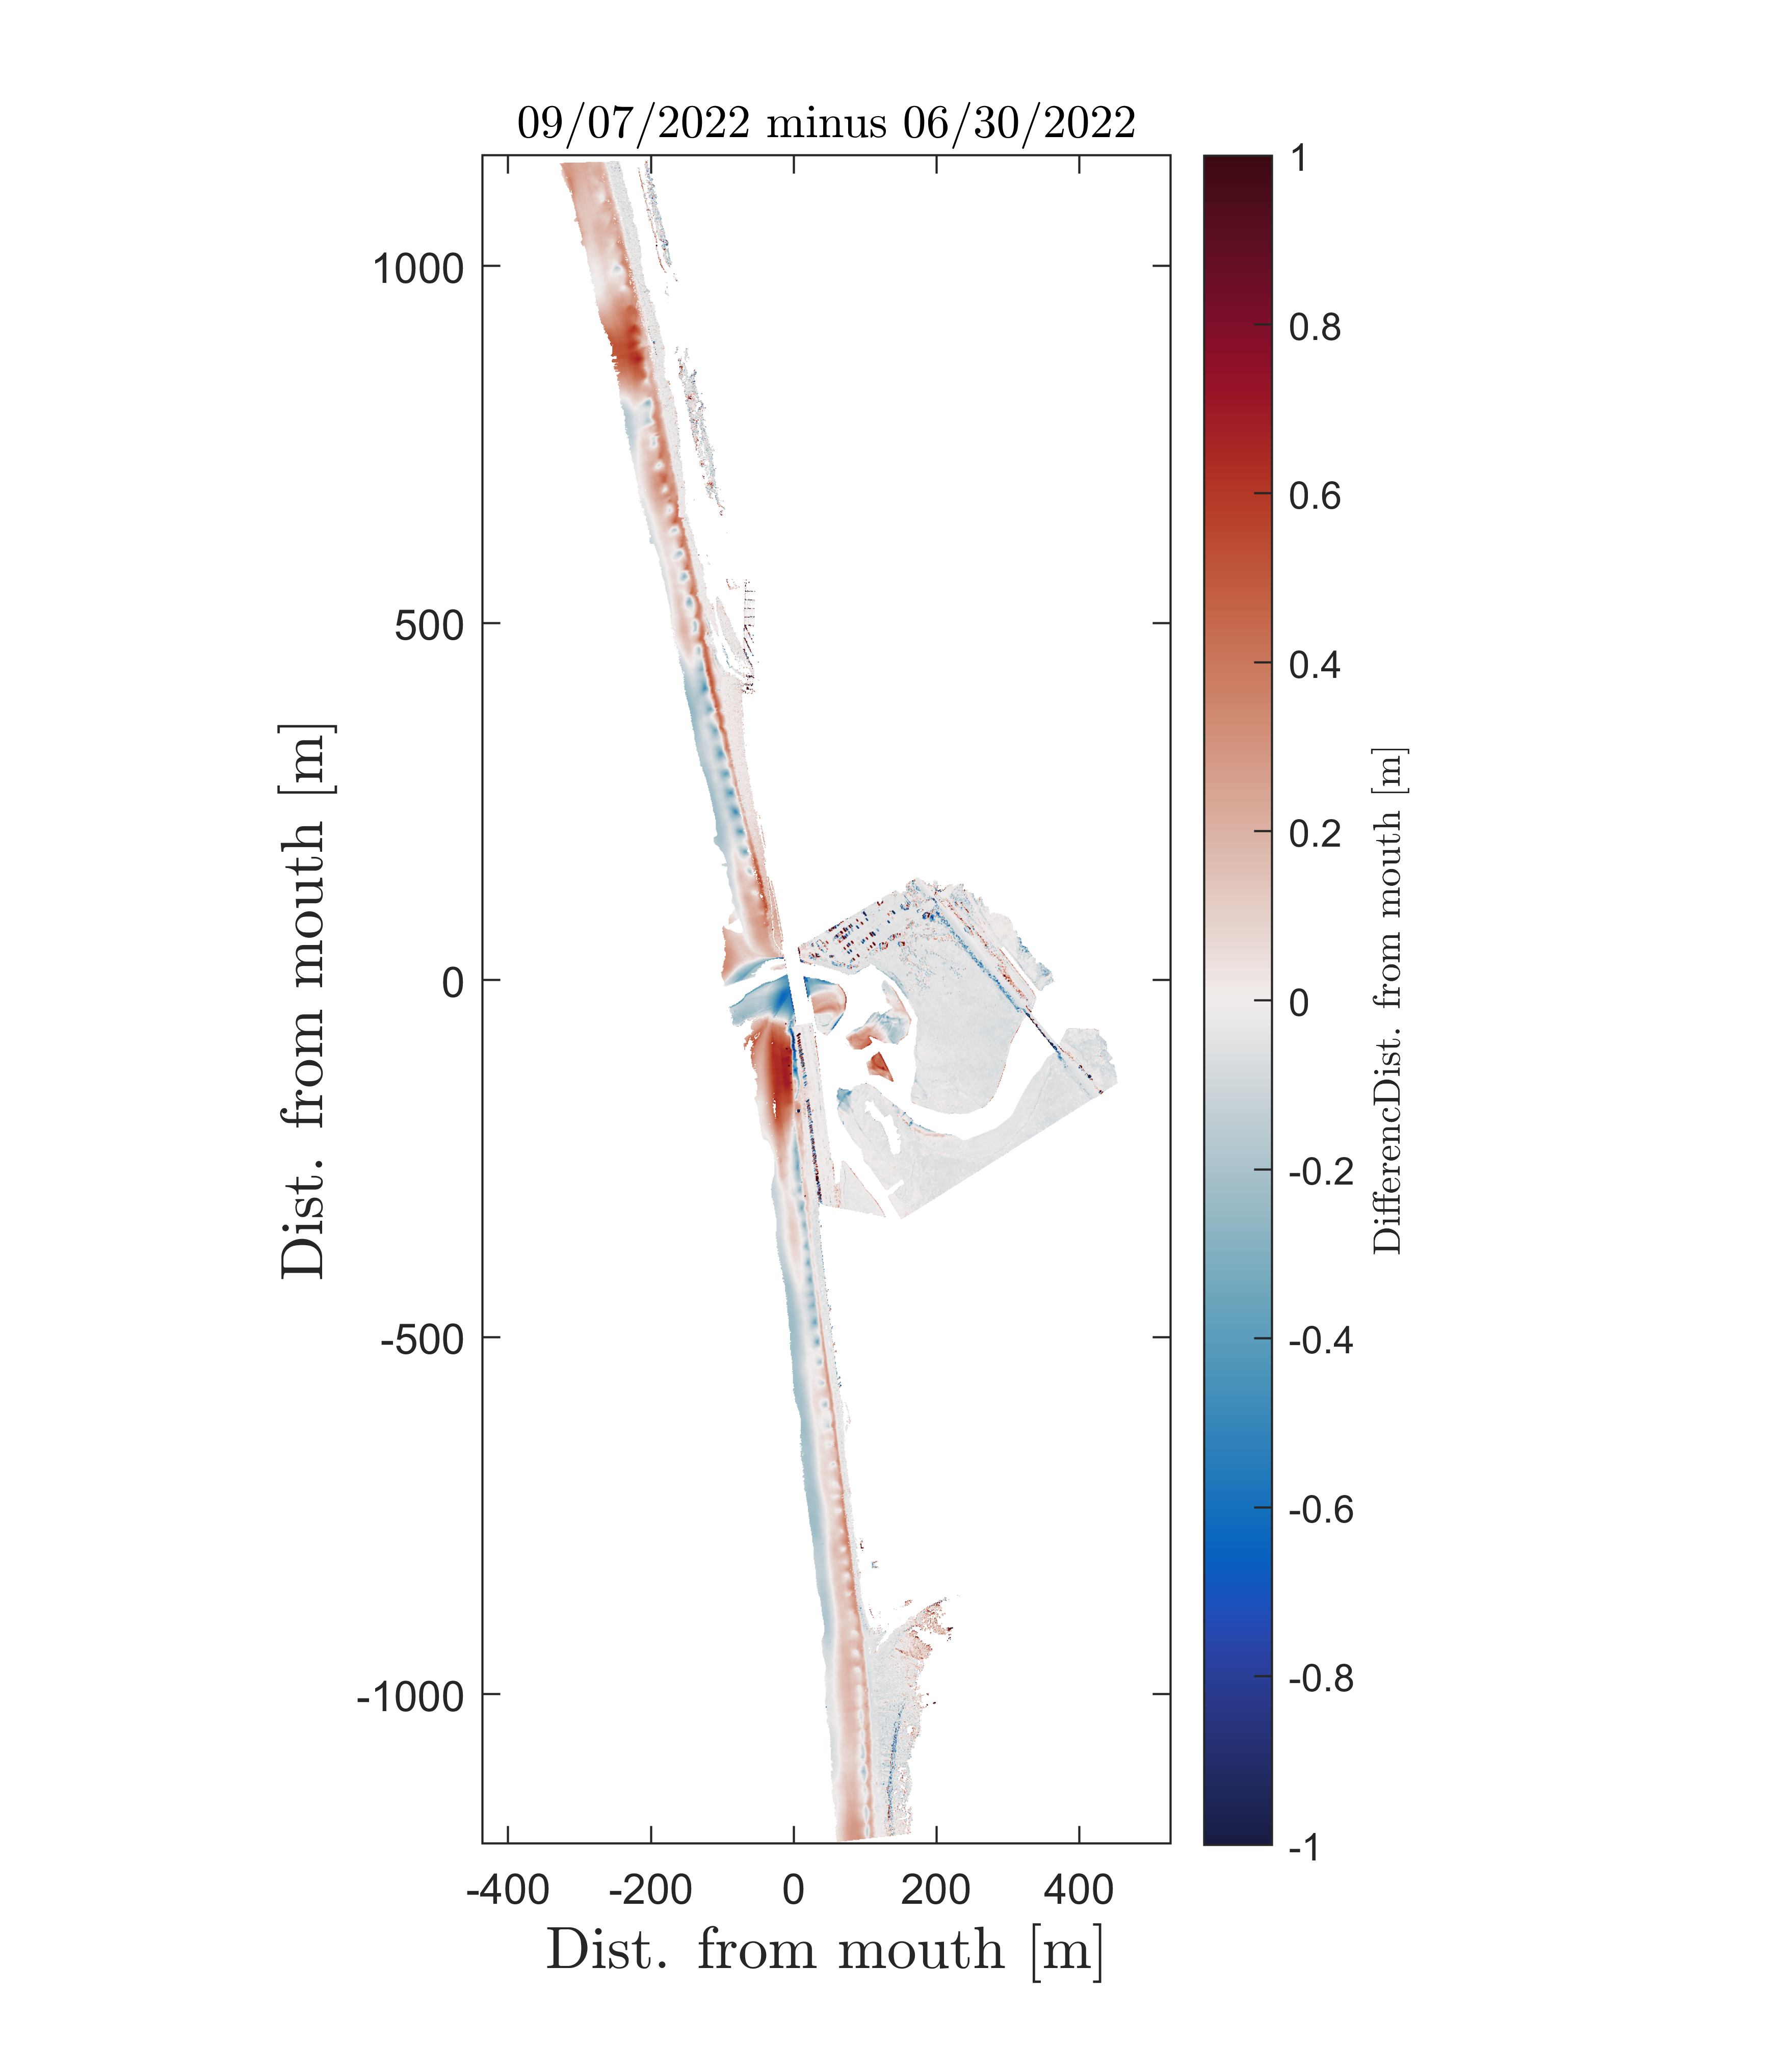
Final topo/bathy maps and differences maps collected across the estuary/beach coupled system for 2022 are presented in the following figures. Note that based on our methodological assessment above, these final maps represent combined UAV/LiDAR data with UAV over the estuary mouth and LiDAR along the beach. Moreover water detection is done using a semi-automatic water-detection algorithm that includes automatic water-detection with both k-mean classification and elevation cutoffs, followed by manual editing.
Final topo/bathy maps:


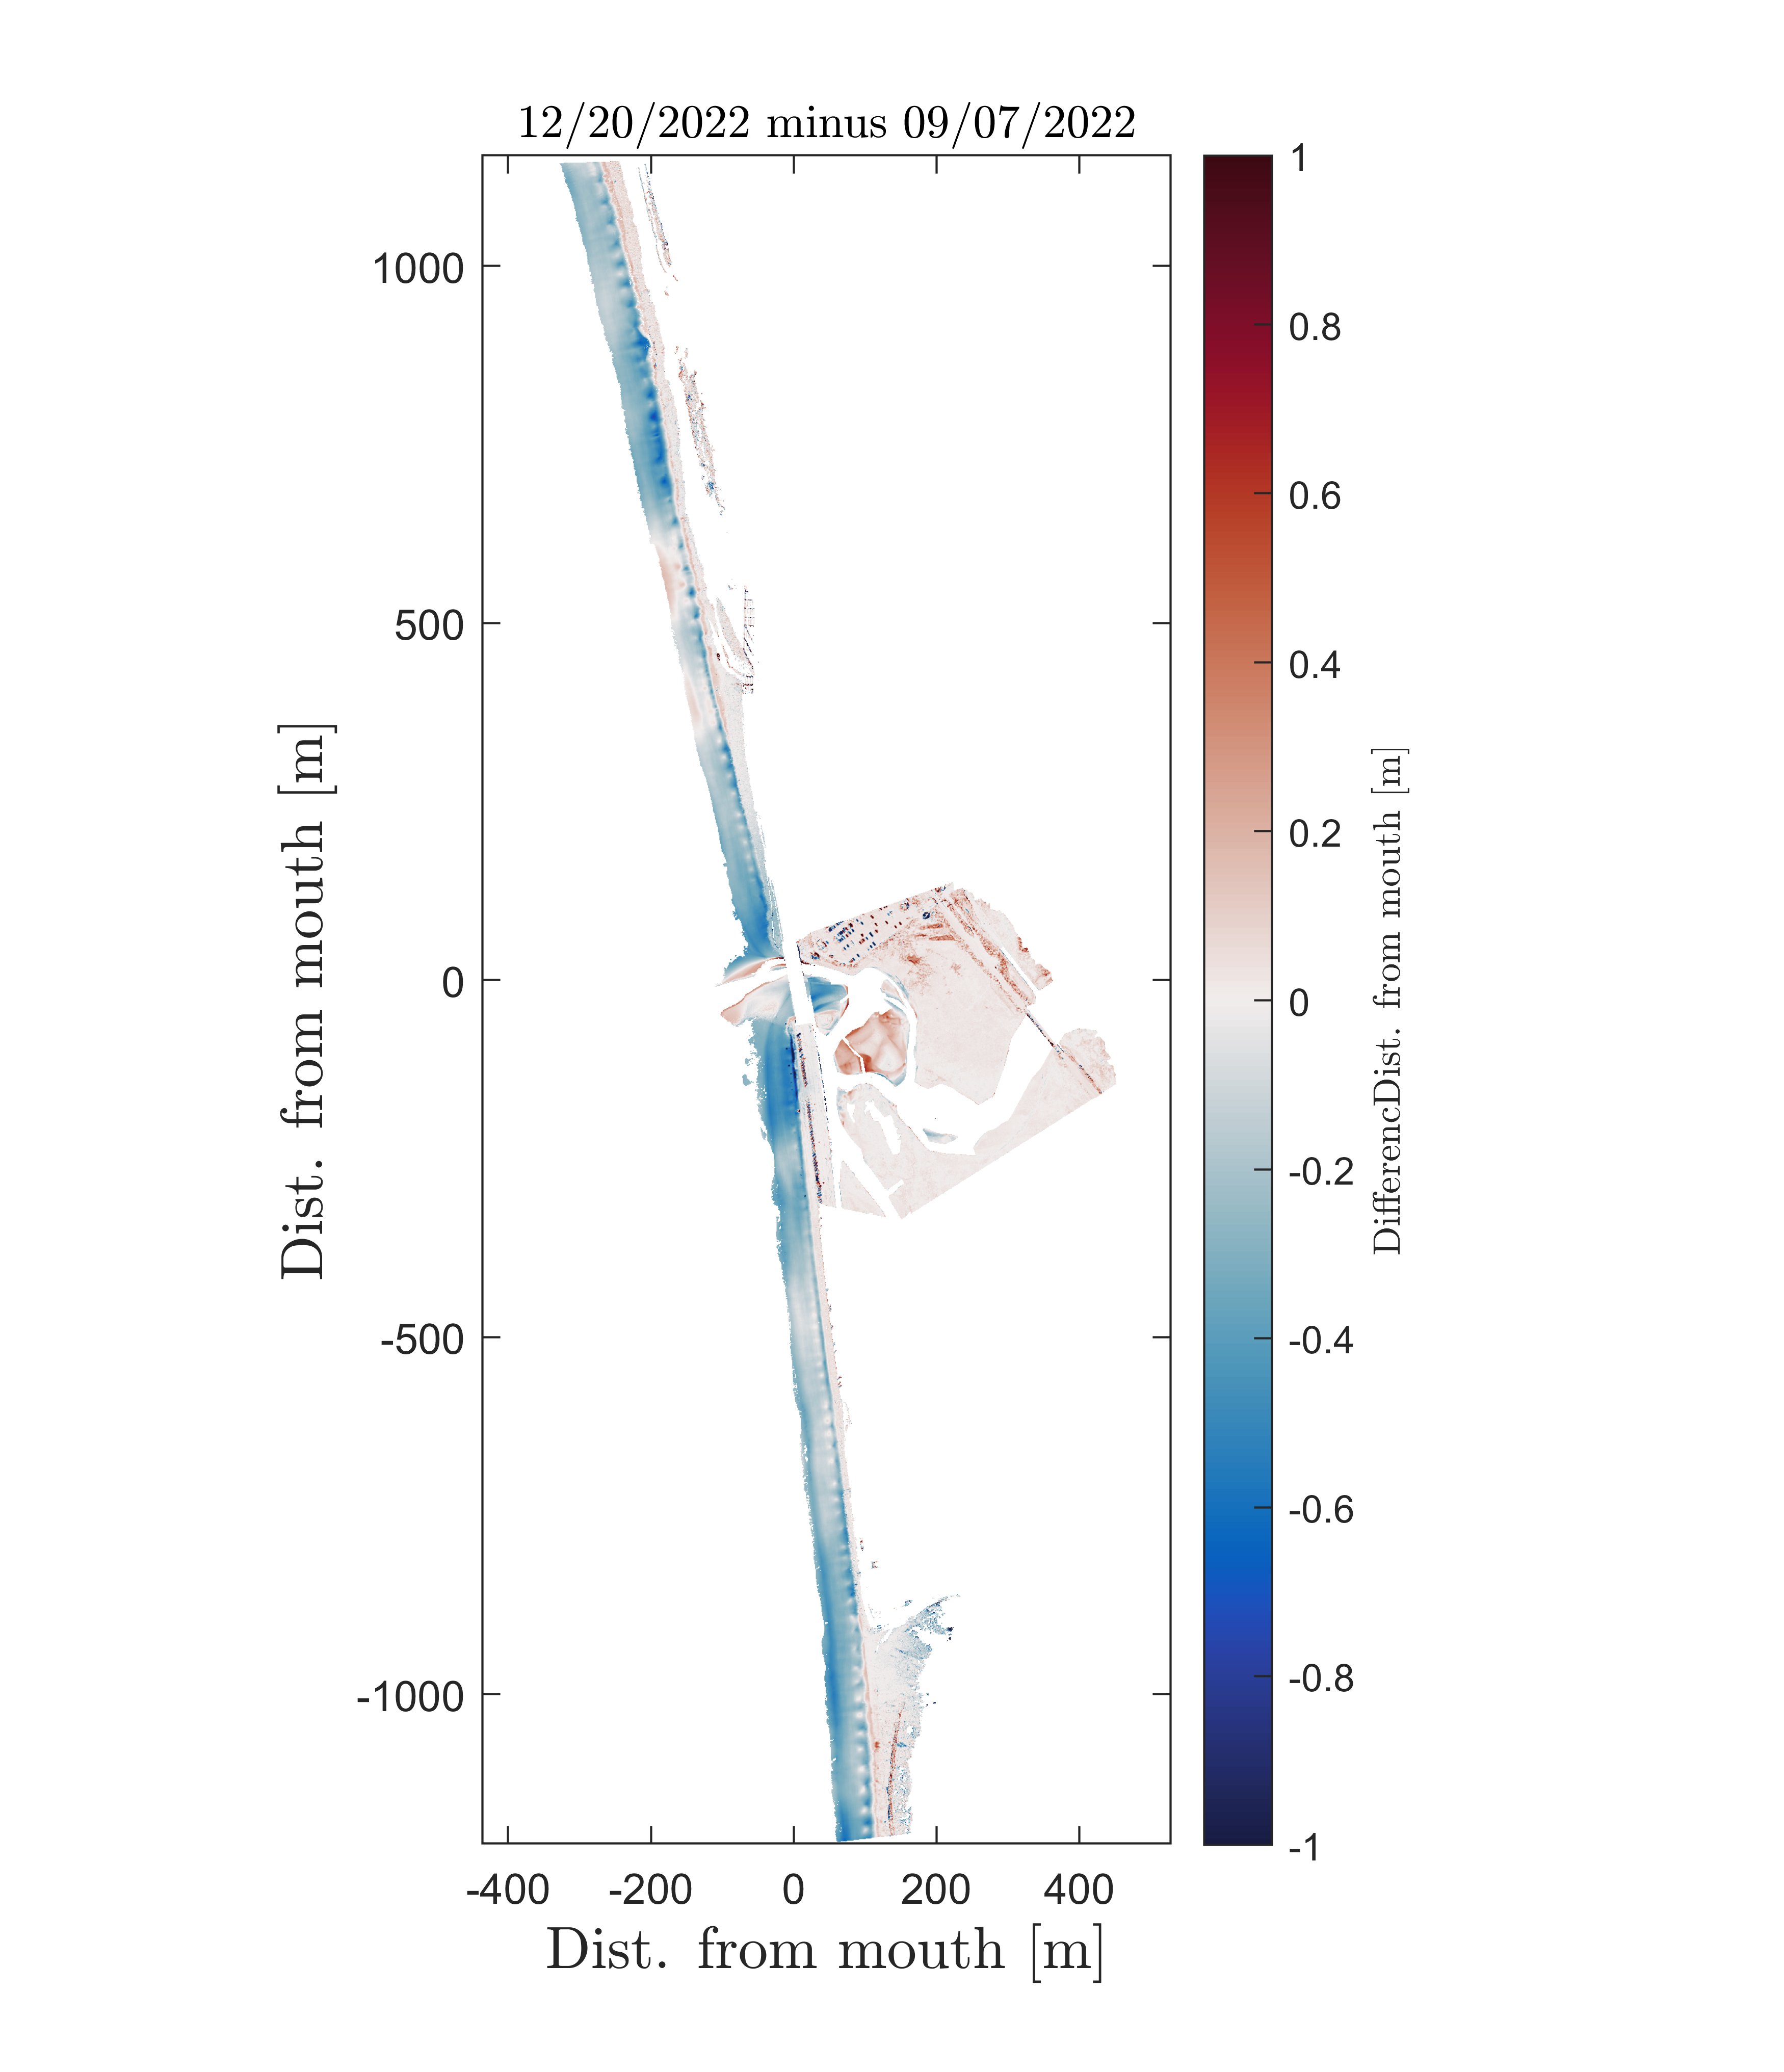
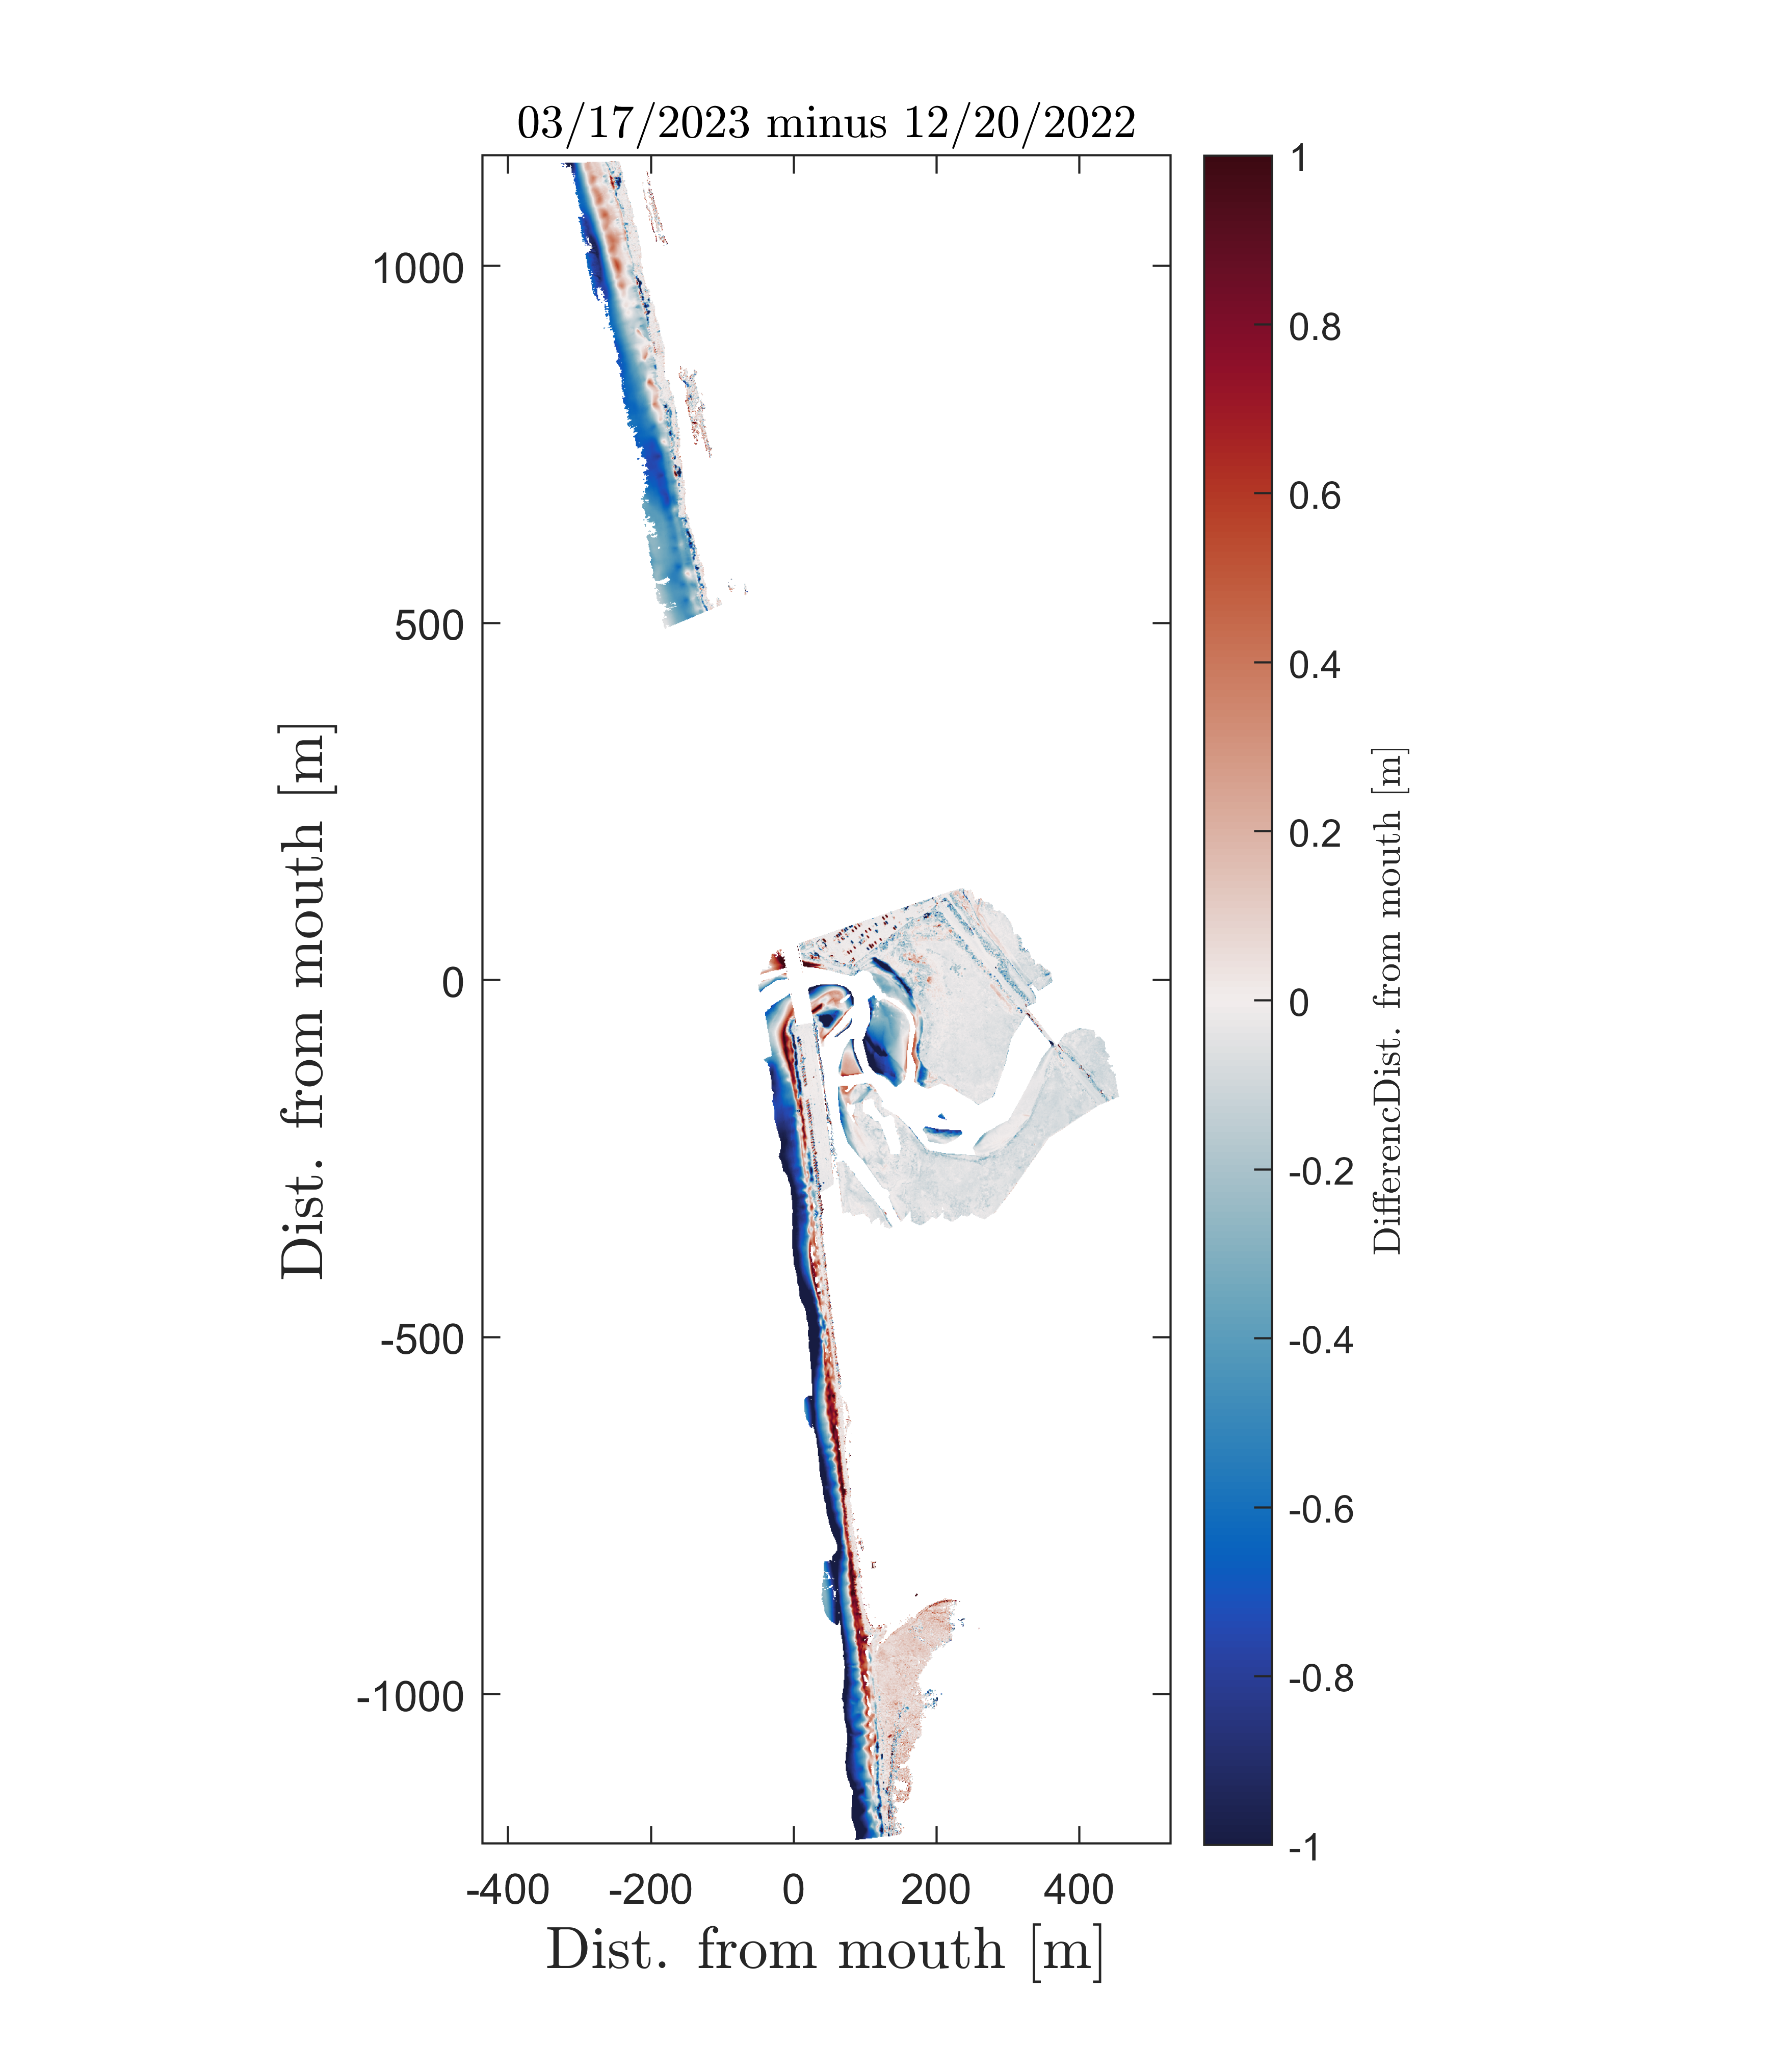
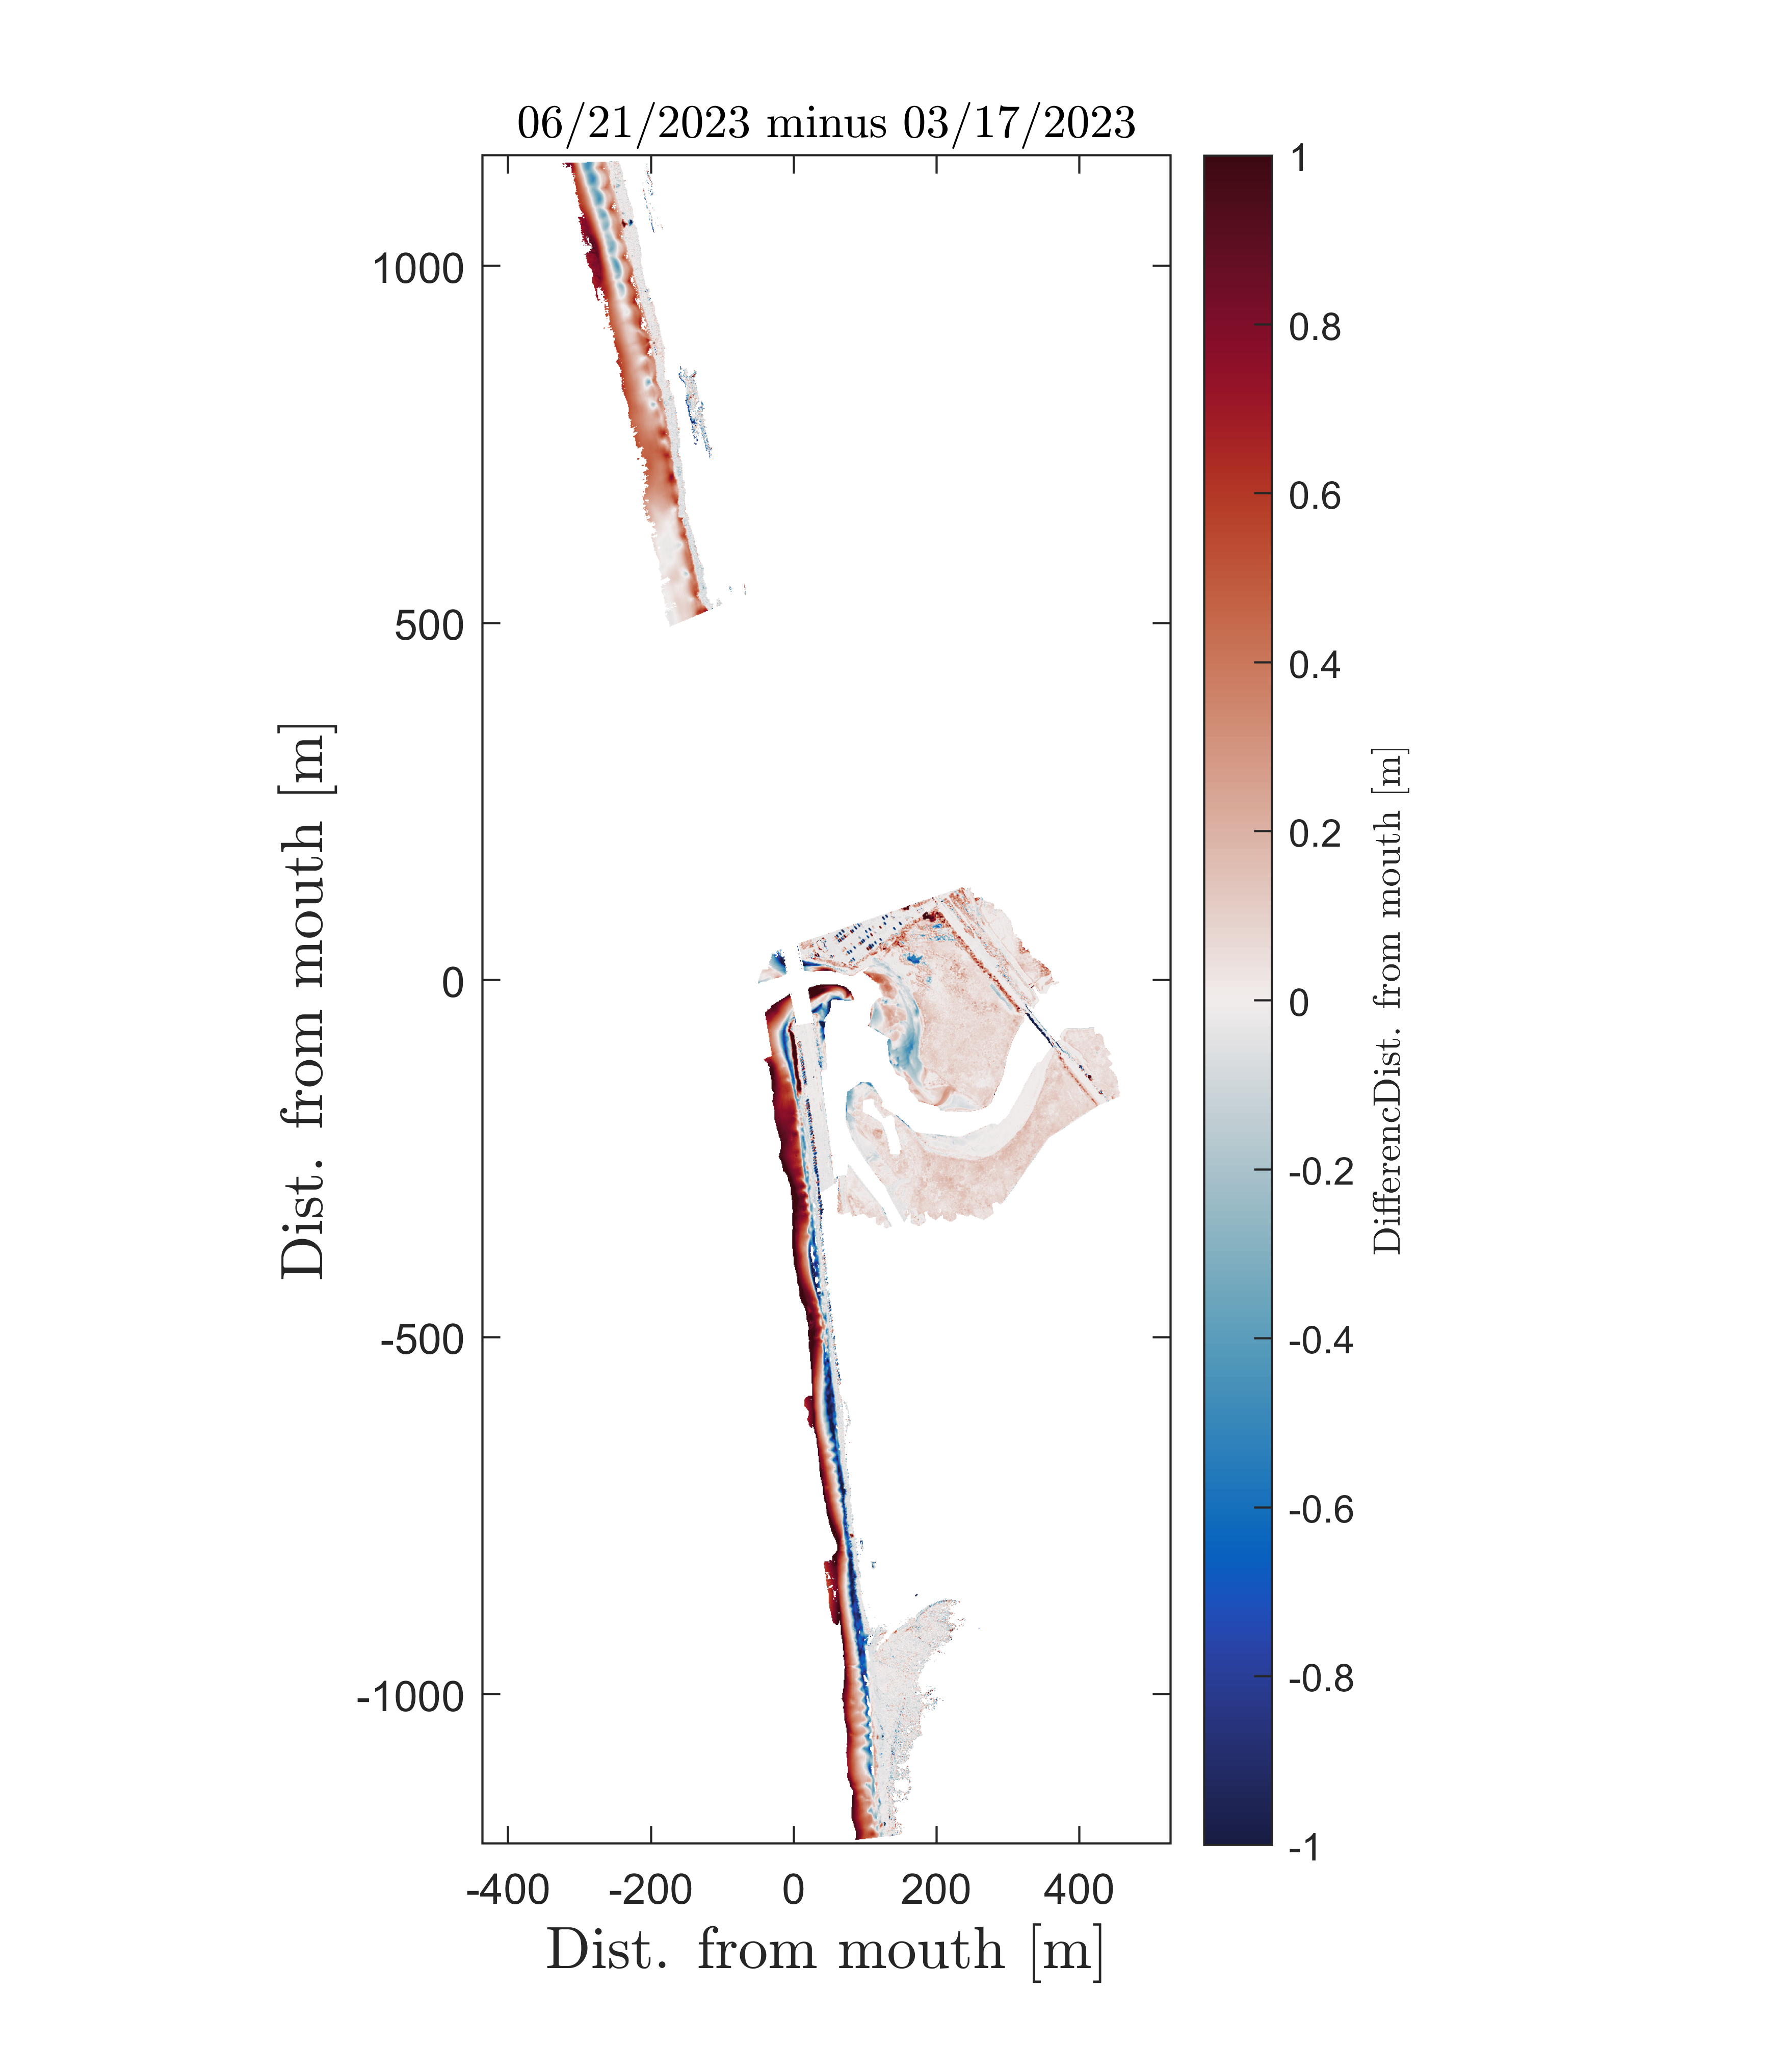
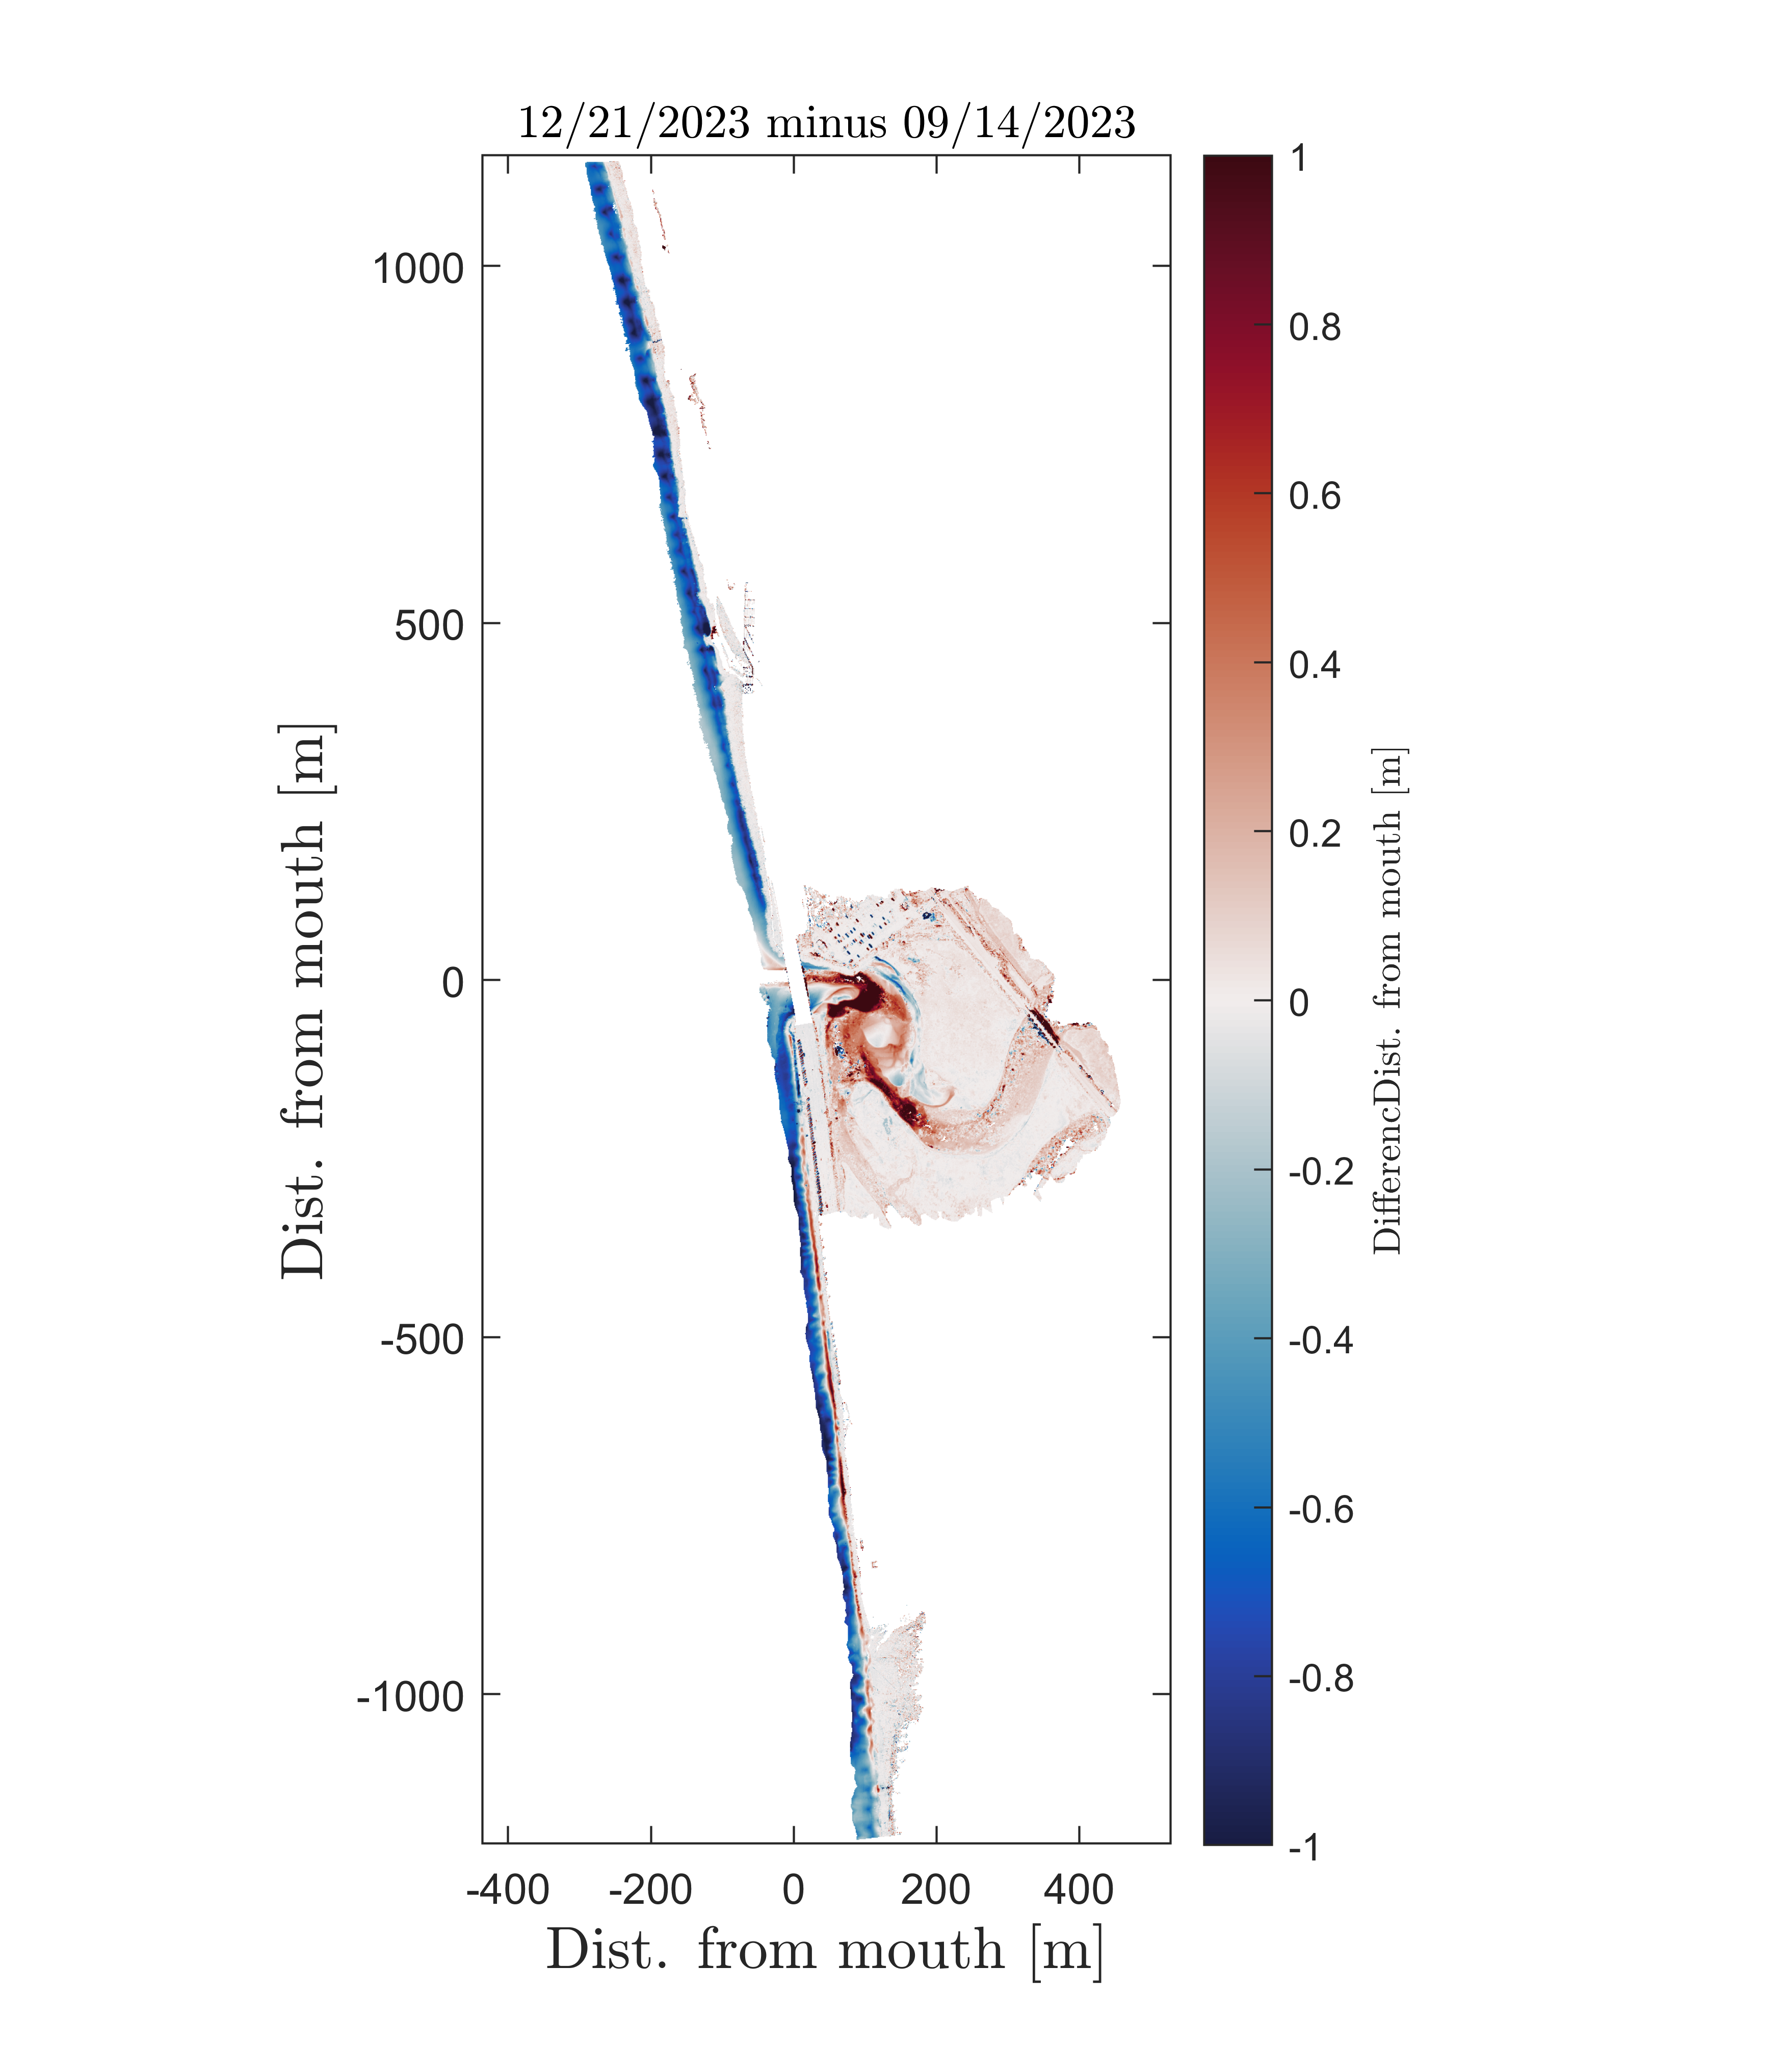
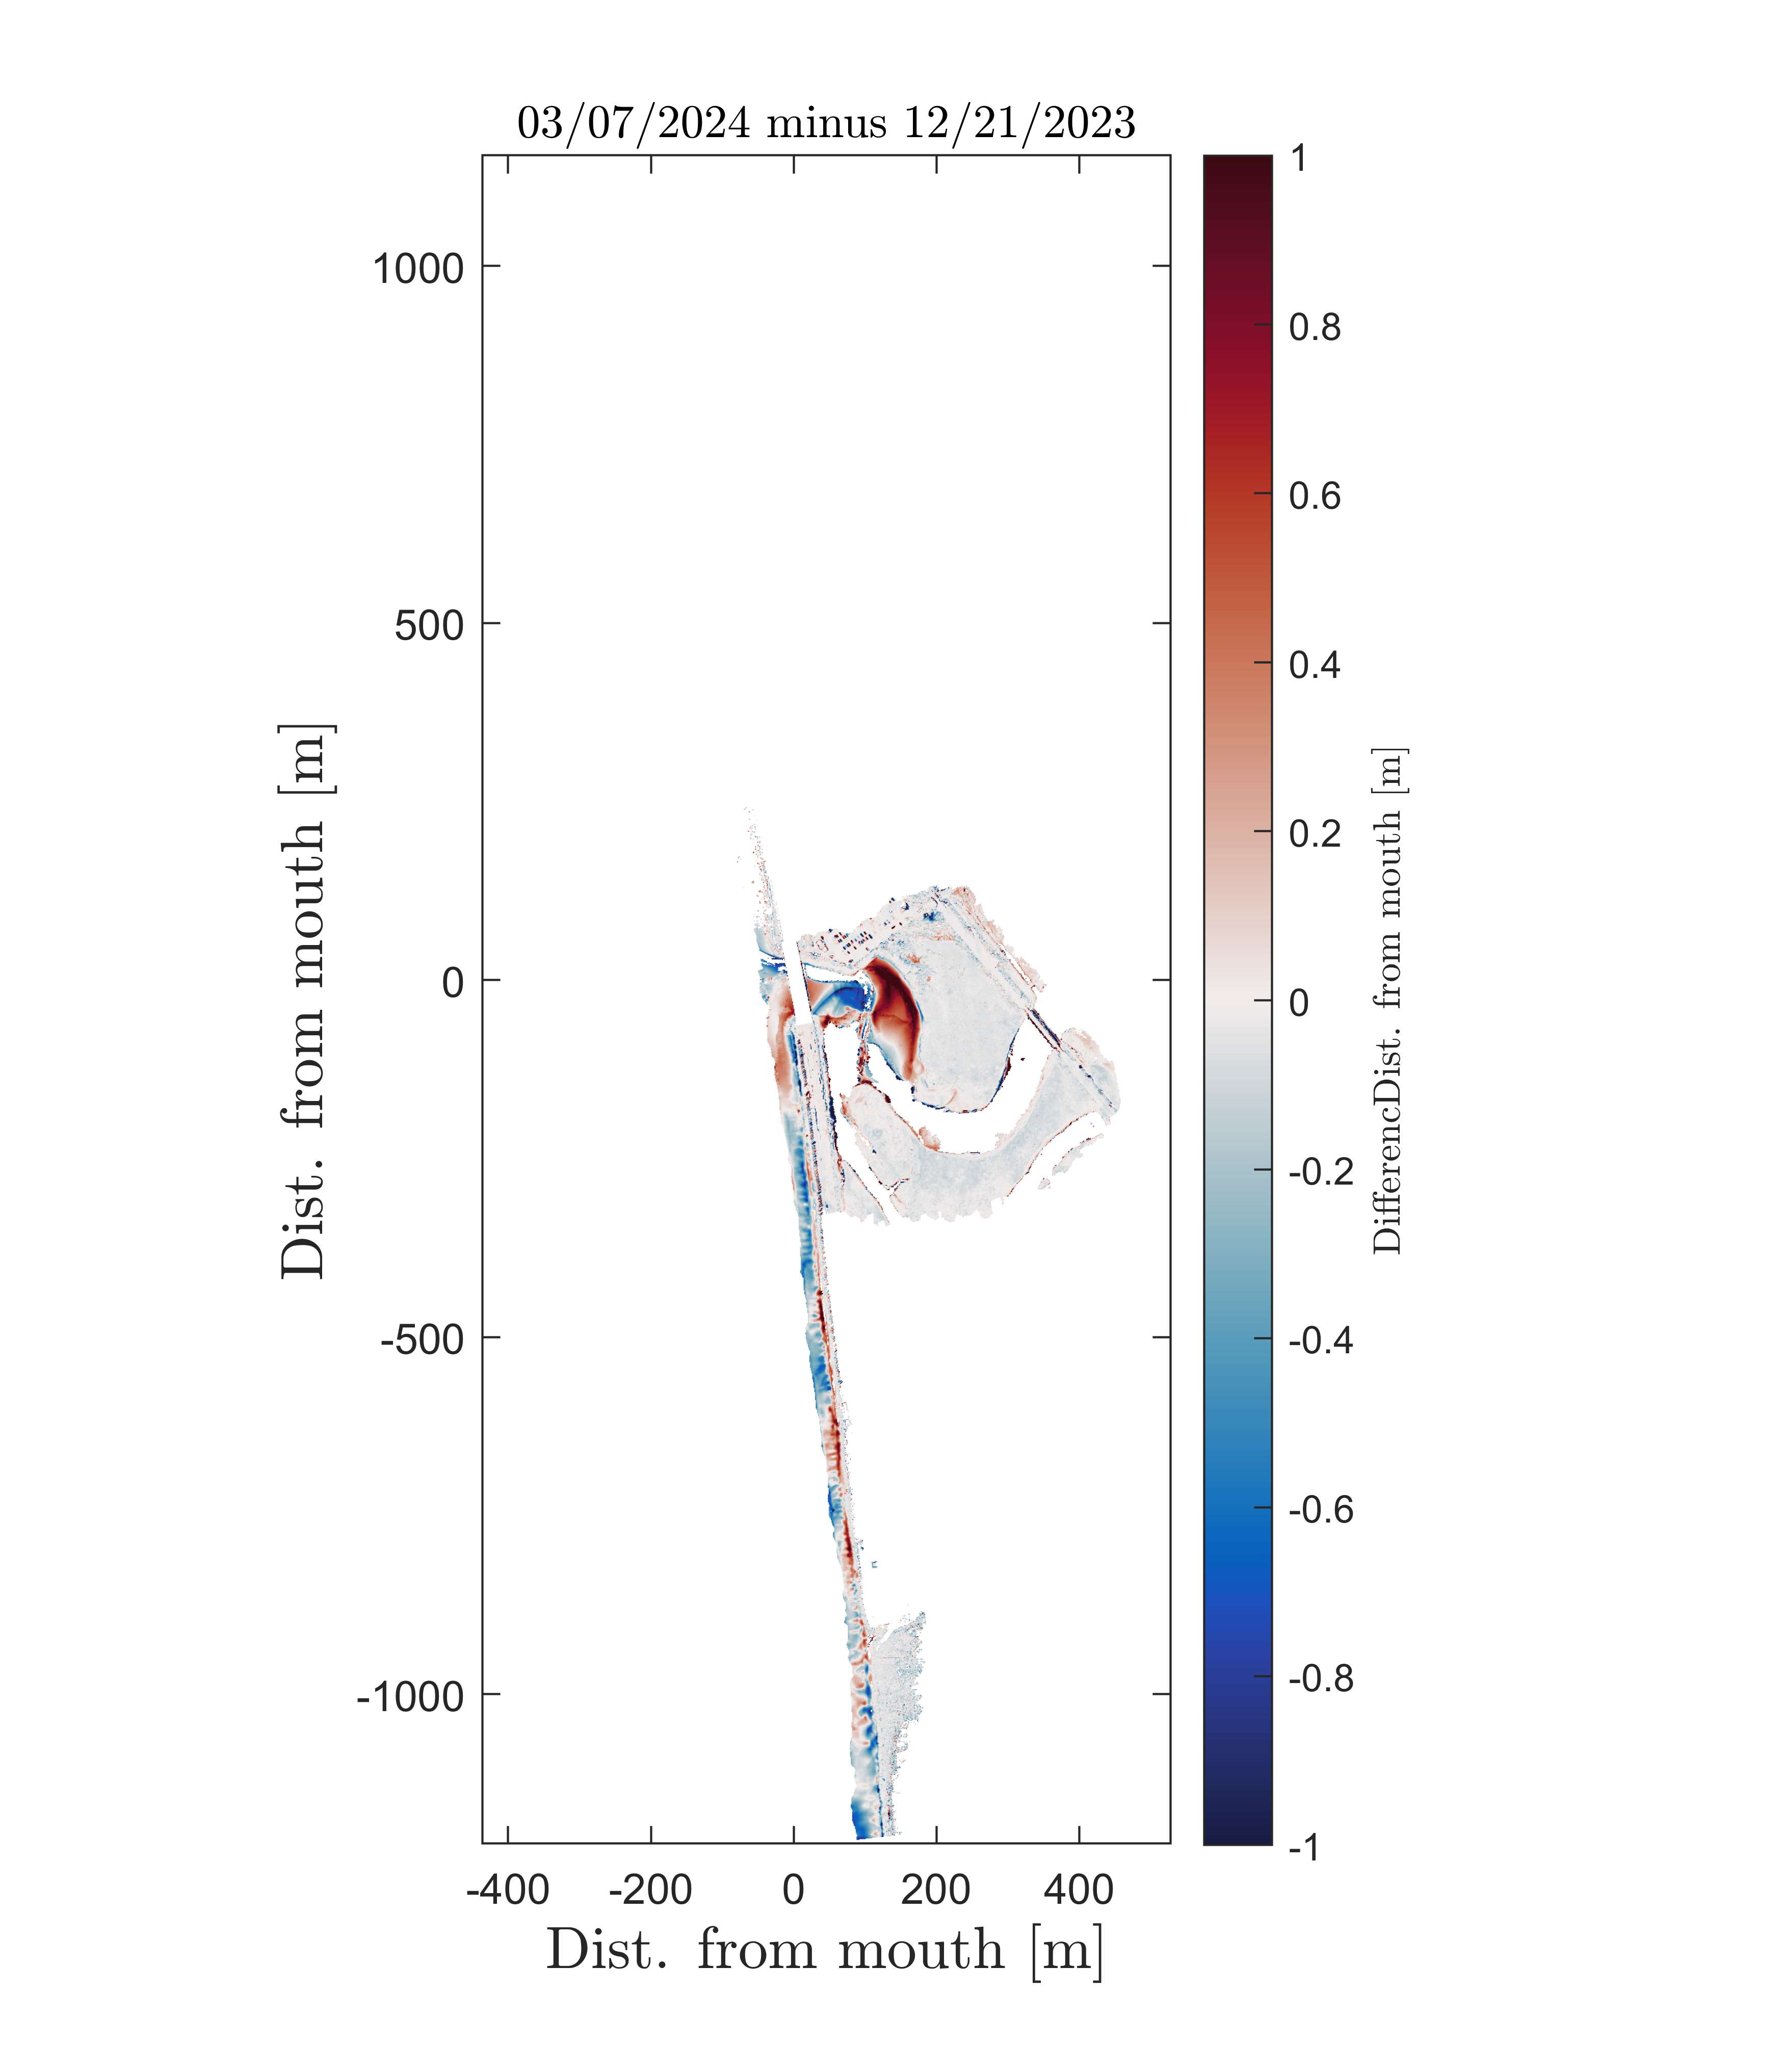
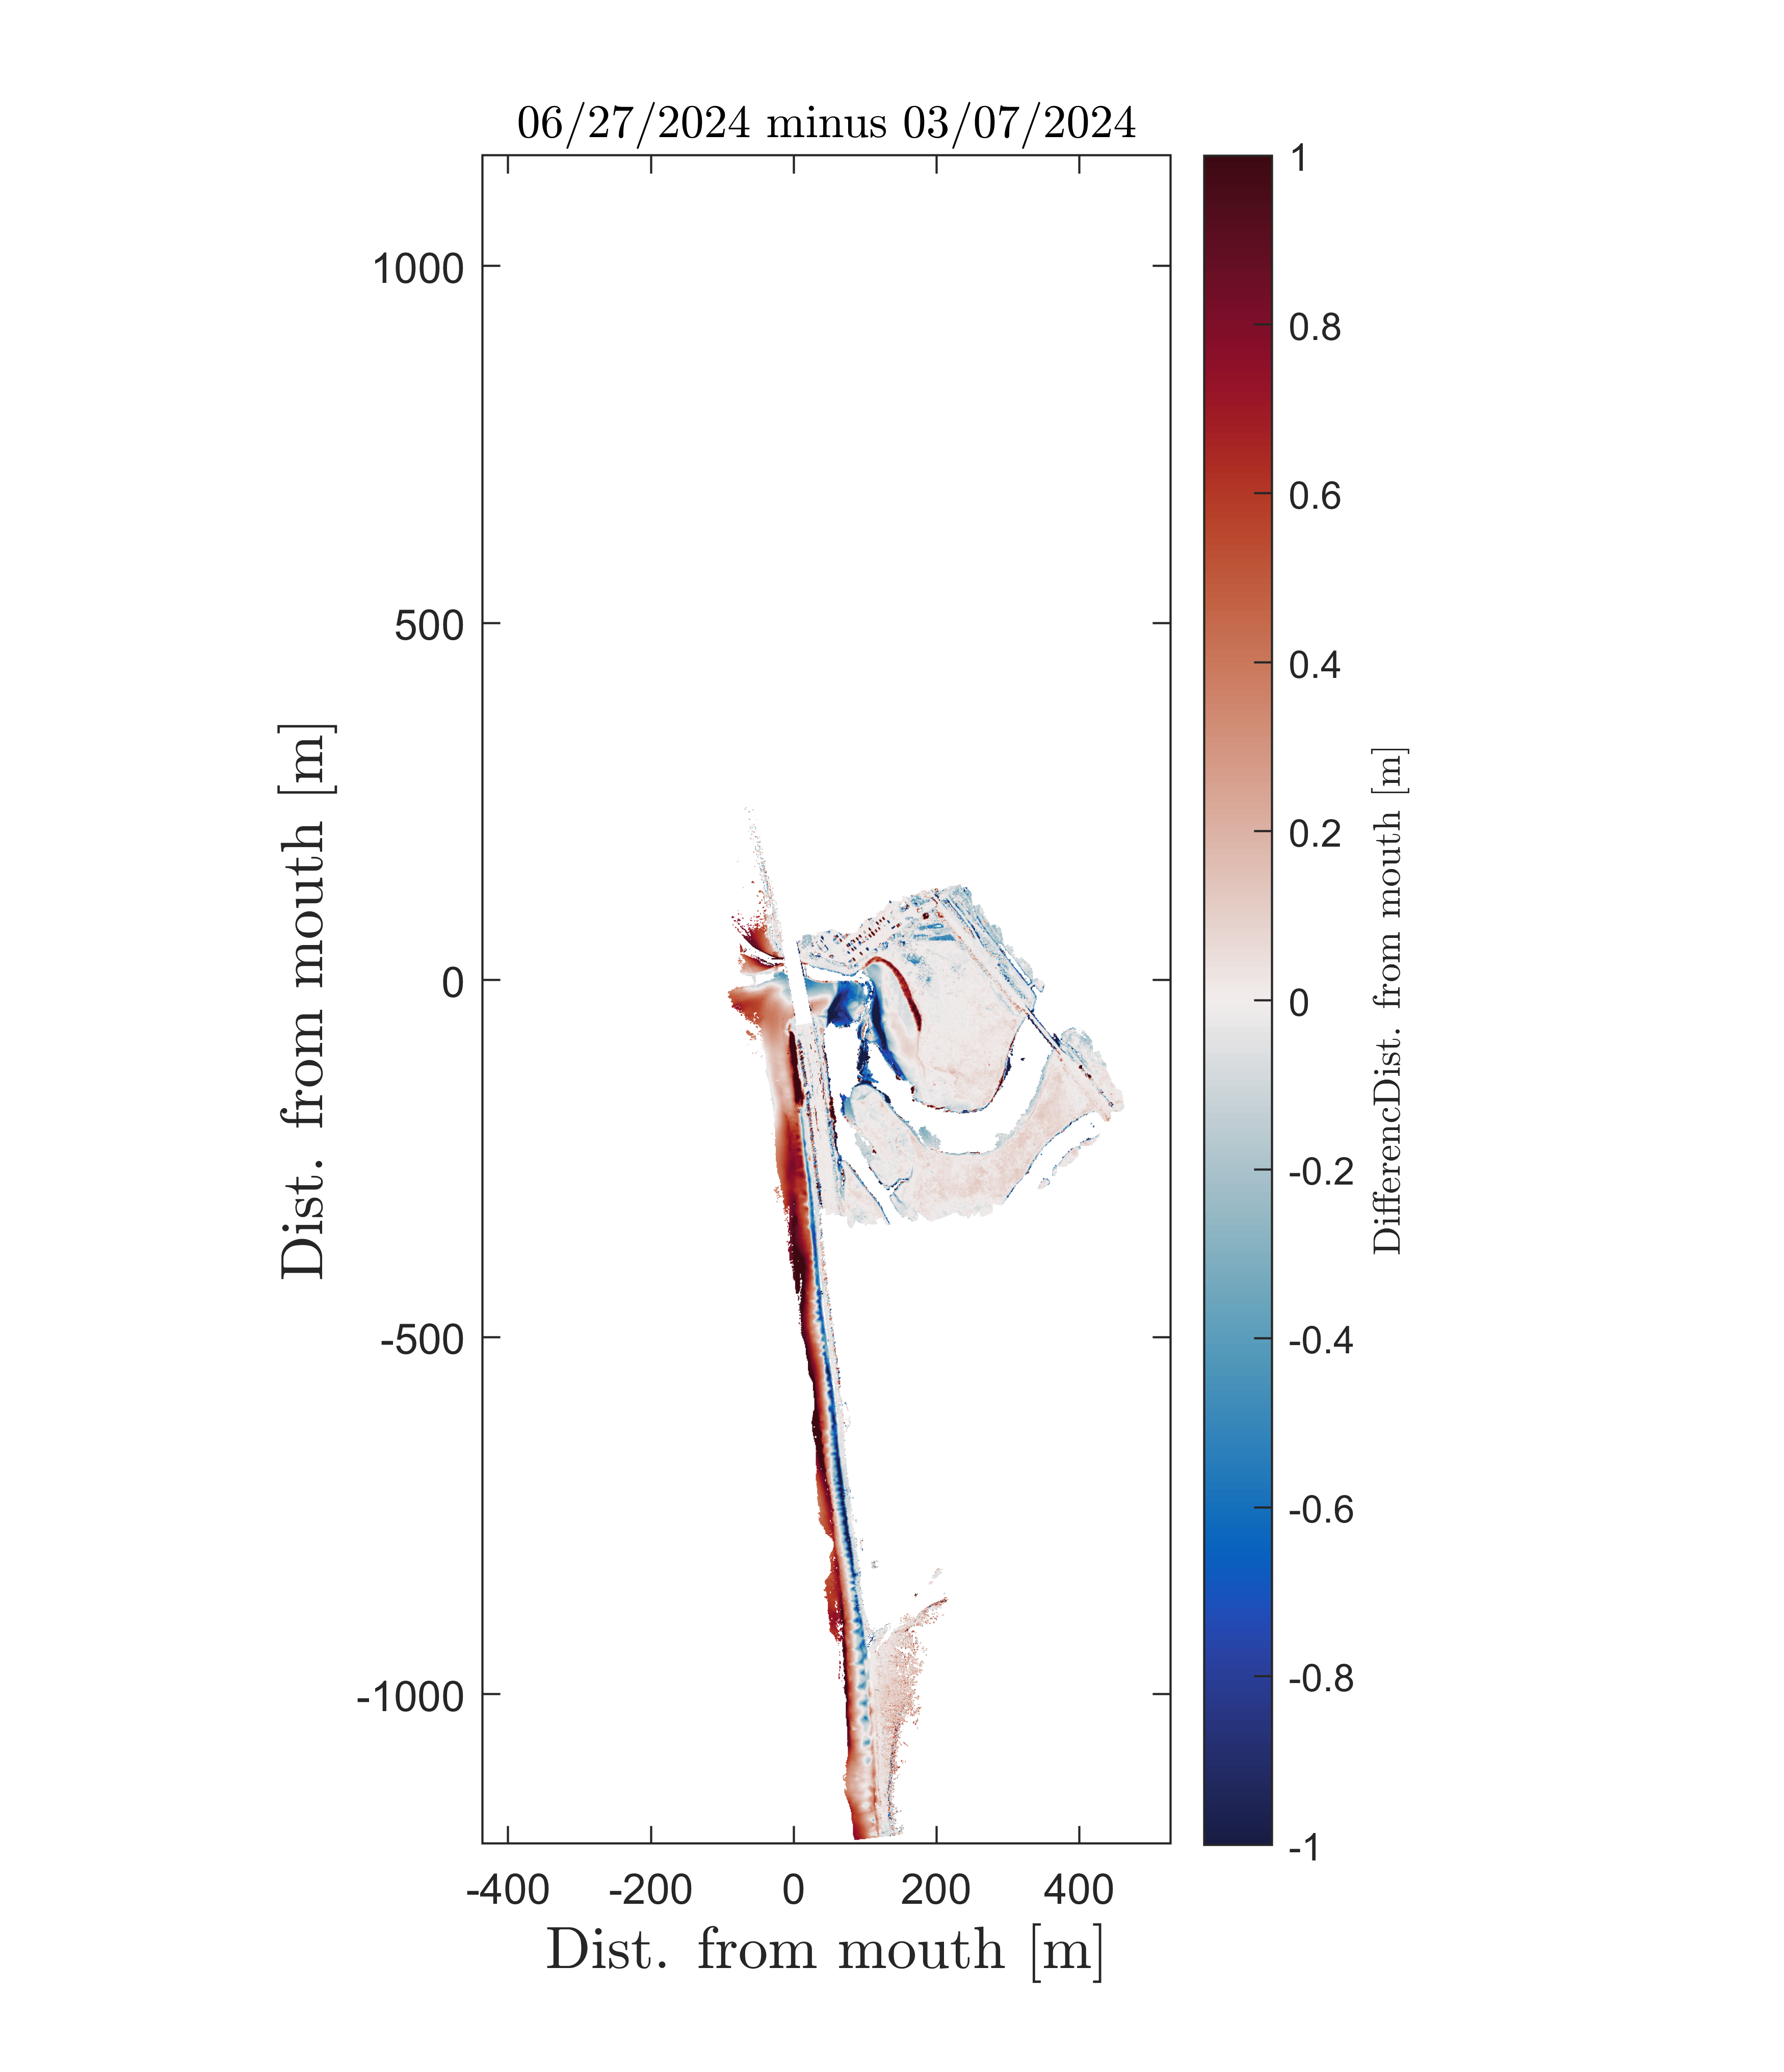
Difference maps:
It is important to note that significant changes can occur on timescales shorter than the quarterly survey cycle as demonstrated by the figure below. Here we created a very high resolution composite topo-bathymetry maps for 20 Jan and 01-02 Feb 2023. The data for these maps includes not only UAV/LiDAR data collected as part of this contract, but also biweekly LiDAR data from Dr. Young’s work, ongoing CPG offshore jumbo surveys, opportunistic LiDAR sampling further into the estuary, and push-dolly RTK-GPS measurements we collected during our NSF project across the estuary mouth. These surveys just 12 days apart show rapid channel migration and accretion. A bar was built on the north side of the estuary mouth (sand and cobble) pushing the inlet to the south and the channel became significantly shallower. These snapshots document mouth migration and accretion approaching a subsequent mouth closure on 07 Feb 2023.
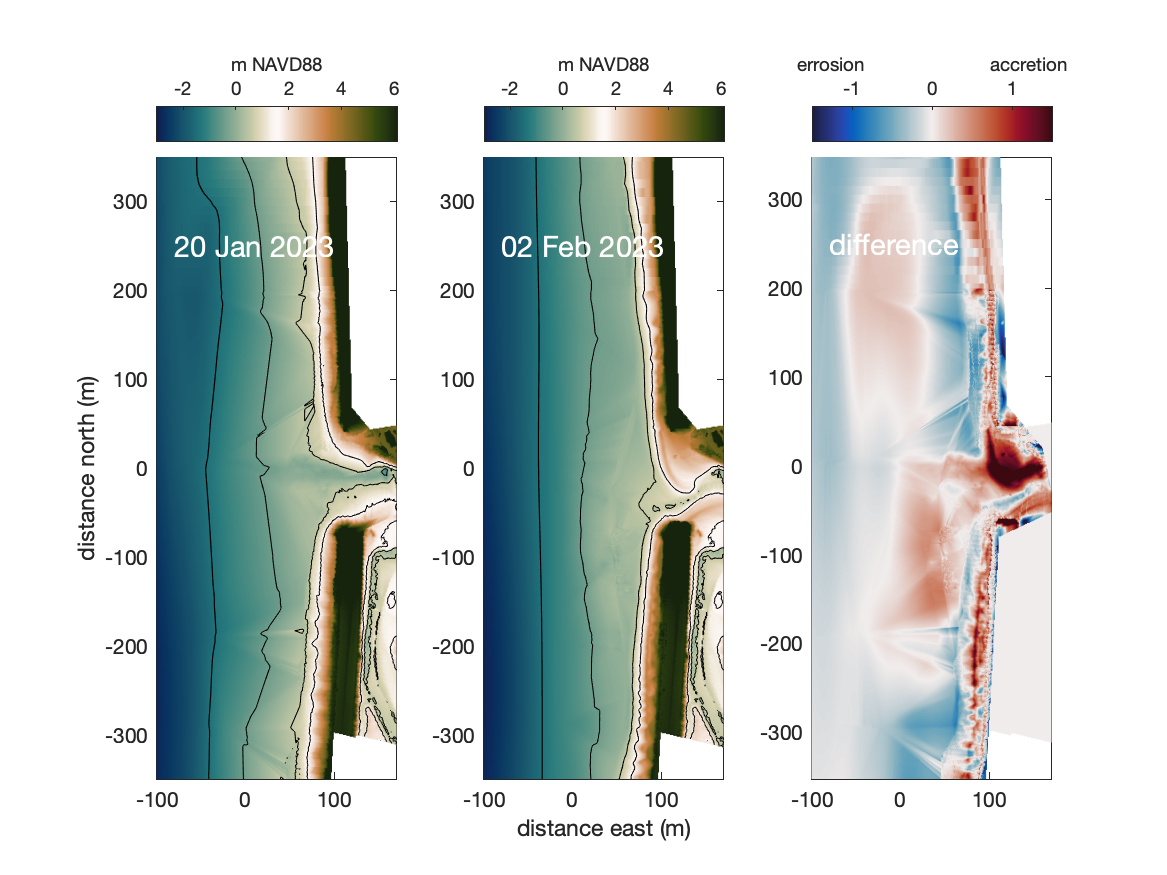
Figure 6. Composite drone/LiDAR/ ATV/jetski/ push- cart topo/bathy data collected 20 January 2023 (left) and 01/02 February 2023 (middle) and their difference (right) where positive (red) indicates accretion. Contours on the left and middle figure indicate MLLW (also indicated by the color scale transition) and 1, 2, and 3m below MLLW.
Analysis of the Pajaro River Estuary/Zmudowski State Beach region has so far shown some similarities. Both estuaries are subject to mouth closure and experience truncated lower-low water levels due to the sill at their mouth. They also both experience overtopping events during closure. A closure index developed by collaborator Dr. Orescanin for a nearby estuary, performs fairly well for indicating when the Pajaro estuary mouth is closed, but not well for Los Peñasquitos Lagoon suggesting regional adaptations may be required. This particular index is not a predictive index, rather it uses existing observations to assess when the estuary mouth is closed. Specifically, the metric subtracts the upstream water levels from the offshore tides and an exceedance value is defined beyond which the estuary is assumed closed. In the Pajaro River Estuary, there is connectivity from the coastal ocean, through the estuary, upstream into the significantly human managed and modified region upstream including clear influence of sill overtopping events propagating upstream of flow diversion structures. The lower-low water sill-height metric as described in Harvey et al., 2020, appears to work well in both estuaries for definning an approximate sill height.
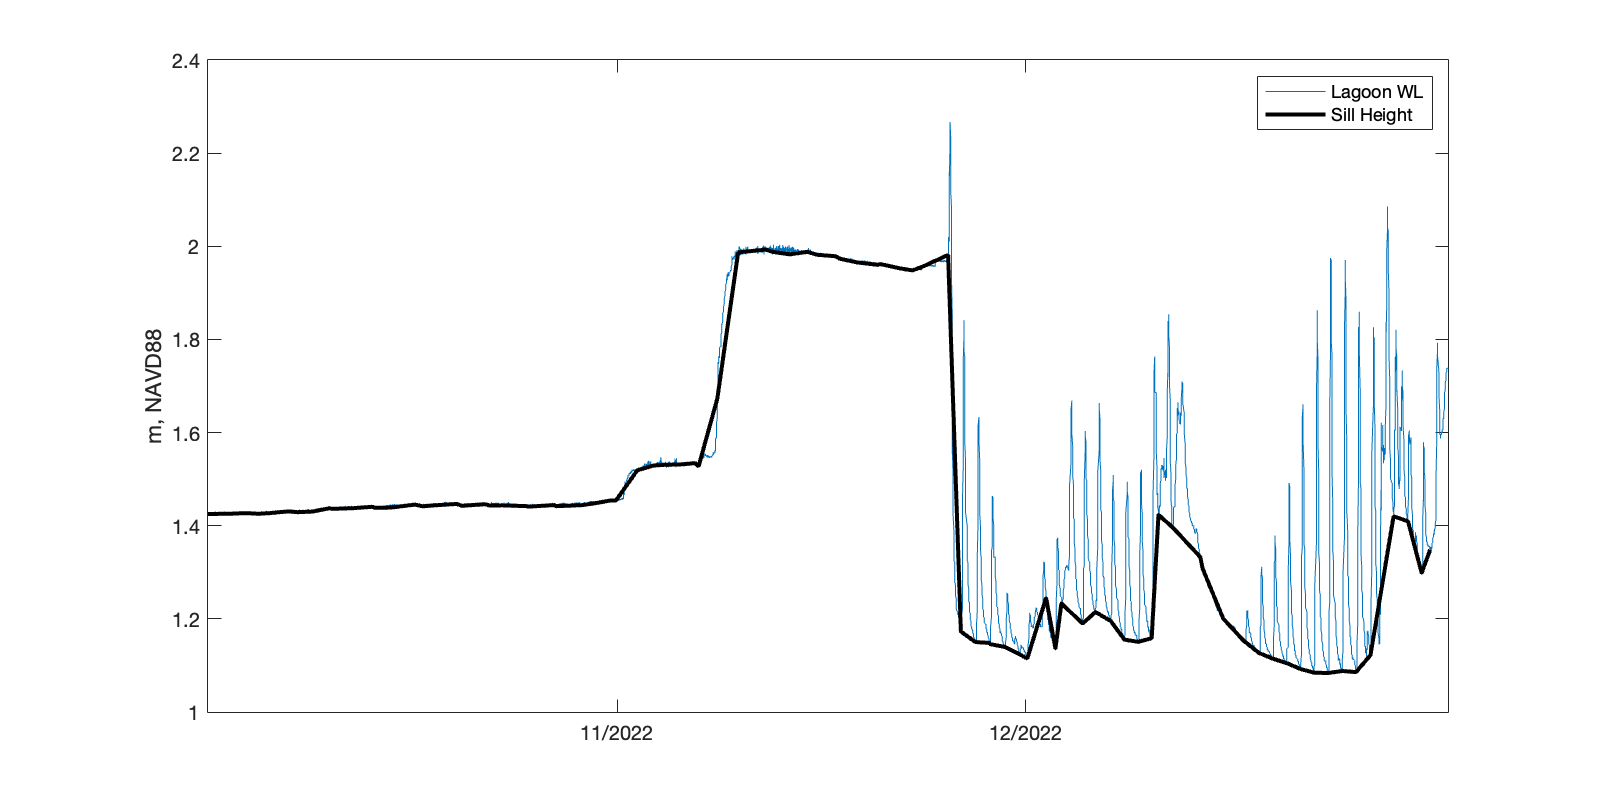
Figure 7. Pajaro sill height (black) and raw water levels (blue) using the Harvey et al., 2020, lower-low water metric over the new dataset, water level logger deployed 01 October 2022 during a mouth closure.
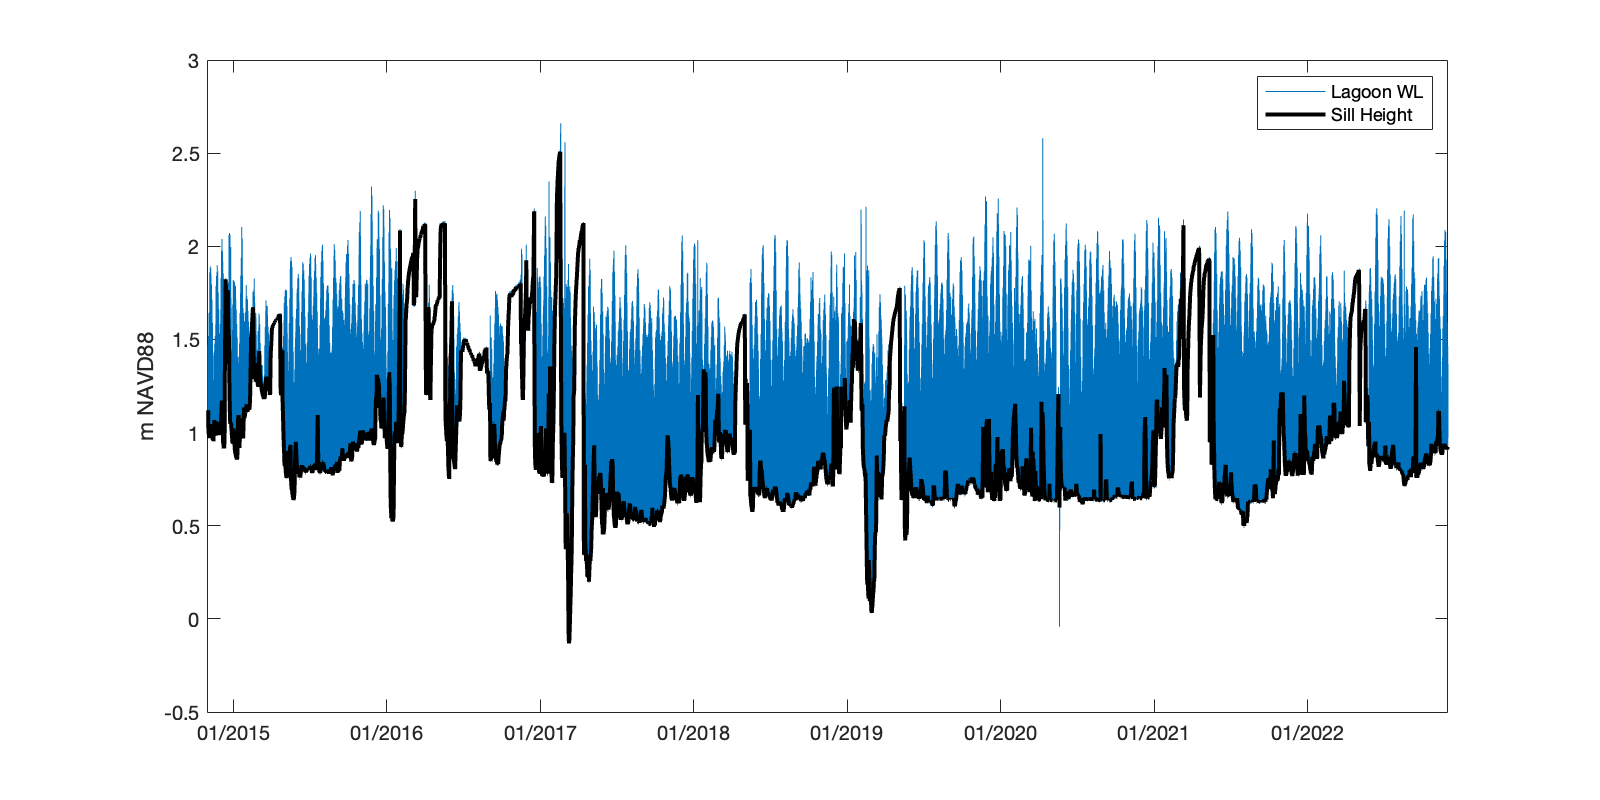
Figure 8. Los Peñasquitos Lagoon sill height (black) and raw water levels (blue) using the Harvey et al., 2020, lower-low water metric over the historical dataset, TRNERR water level logger (Nov 2014-Dec 2022, sometimes supplemented by water level measured by our in-situ instruments deployed as part of this award and prior awards)