
Beaches in the San Diego/Tijuana shoreline are sometimes contaminated with untreated sewage because of inadequate wastewater infrastructure. In particular, the San Antonio de los Buenos wastewater treatment plant, 10 km south of the US/Mexico border, can only treat a fraction of the wastewater that is diverted to it. The remaining effluent bypasses the treatment plant and is emptied directly onto the beach at Punta Bandera. This creates an environmental hazard, as untreated sewage is full of pathogens that can cause gastrointestinal distress in swimmers.
Unfortunately, this wastewater does not just affect Punta Bandera. Microbial DNA source testing by the Southern California Coastal Water Research Project (SCCWRP) has identified San Antonio de los Buenos-sourced contamination as far north as Silver Strand State beach, 20 km away (Source). This happens the San Diego/Tijuana shoreline is straight and sandy, which makes it easy for material in the surf zone to be carried by wave-driven currents. When waves come in from the south (common during summer weather in the San Diego/Tijuana region), material in the surf zone moves northward.
Postdoctoral scholar Dr. Elizabeth Brasseale has been using regional hydrodynamic models to investigate patterns in exposure of the San Diego/Tijuana shoreline to these untreated wastewater plumes from the San Antonio de los Buenos wastewater treatment plant. The movie below demonstrates 3 years of tidally-filtered regional hydrodynamic model output, an extension of the NADB model (Source). This model is nested in the same parent grid as the Los Peñasquitos Lagoon model (Source). Dye was used to stand in for wastewater plumes beginning at Punta Bandera (far right, labelled “surface PB dye”). Pollution in the Tijuana River estuary was also represented with dye (fourth panel, labelled “surface TJRE dye”).
Shoreline exposure to dye was linked to wave direction, as expected. The mean surface dye concentrations were estimated for northerly and southerly wave conditions (direction determined using wave properties at an offshore wave buoy location). The concentration of 5×10⁻⁴ is contoured because it is estimated as roughly equivalent to the EPA beach advisory metric. During northerly wave conditions, dye is concentrated around the dye sources. However, during southerly wave conditions, mean dye concentration of 5×10⁻⁴ occupy the shoreline from Punta Bandera to the Tijuana River estuary.
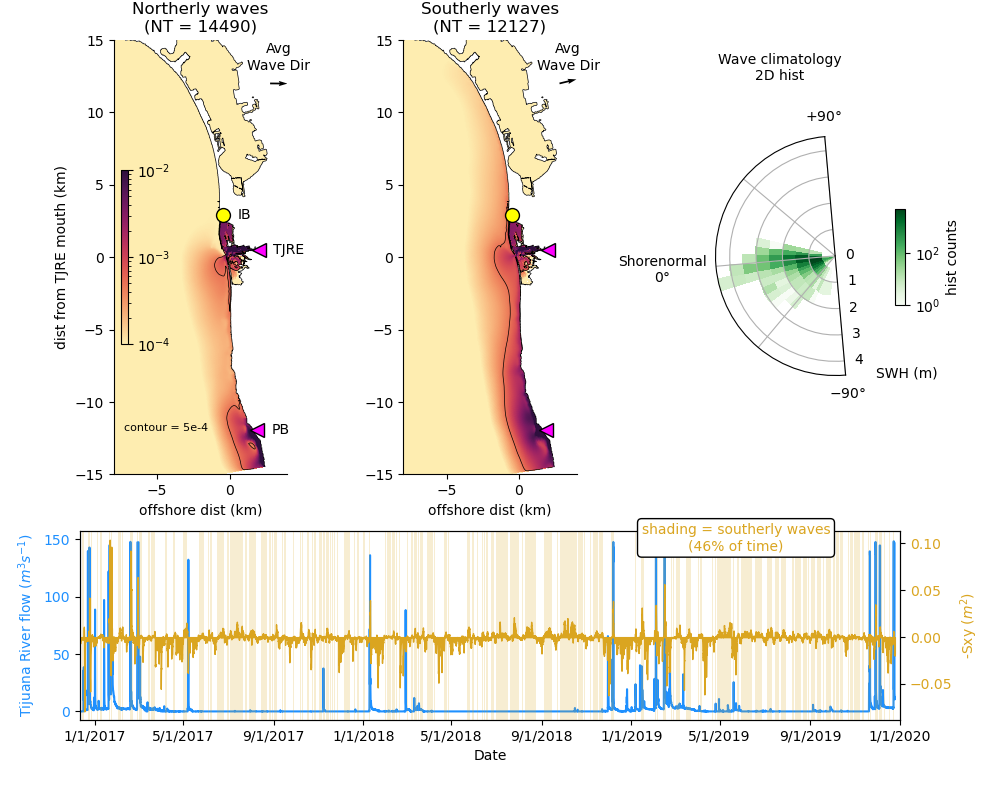
Top left panel is the mean surface dye concentrations (on a logarithmic color scale) from the wastewater treatment plant outfall at Punta Bandera (PB) and the Tijuana River estuary (TJRE) for all time steps with northerly waves, with 5×10⁻⁴ contoured. Second panel is the same but for all time steps with southerly waves. The third panel shows a polar histogram of wave condition occurrences, with wave direction (angle) and significant wave height (radial distance). Bottom panel depicts time series of Tijuana river flow (blue) and wave forcing (i.e., the off-diagonal component of wave radiation stress, gold) over the three year model run. Gold shading in the background indicates southerly wave time steps.
The relationship between waves and nearshore transport was further explored by the development of a 1D nearshore wave-transport model to predict the location of the plume using only offshore wave properties. The 1D wave-transport model was tested against the nearshore dye concentrations in the 3D hydrodynamic model over the course of model year 2017.

Dye concentration as a function of alongshore distance from the wastewater treatment plant outfall for the year 2017. Panel a) is the hydrodynamic model, panel b) is the 1D model. Dashed contour is 5 x 10⁻⁴.
One way we quantified performance of the 1D model was to compare where each model predicted dye concentrations would exceed 5 x 10⁻⁴.
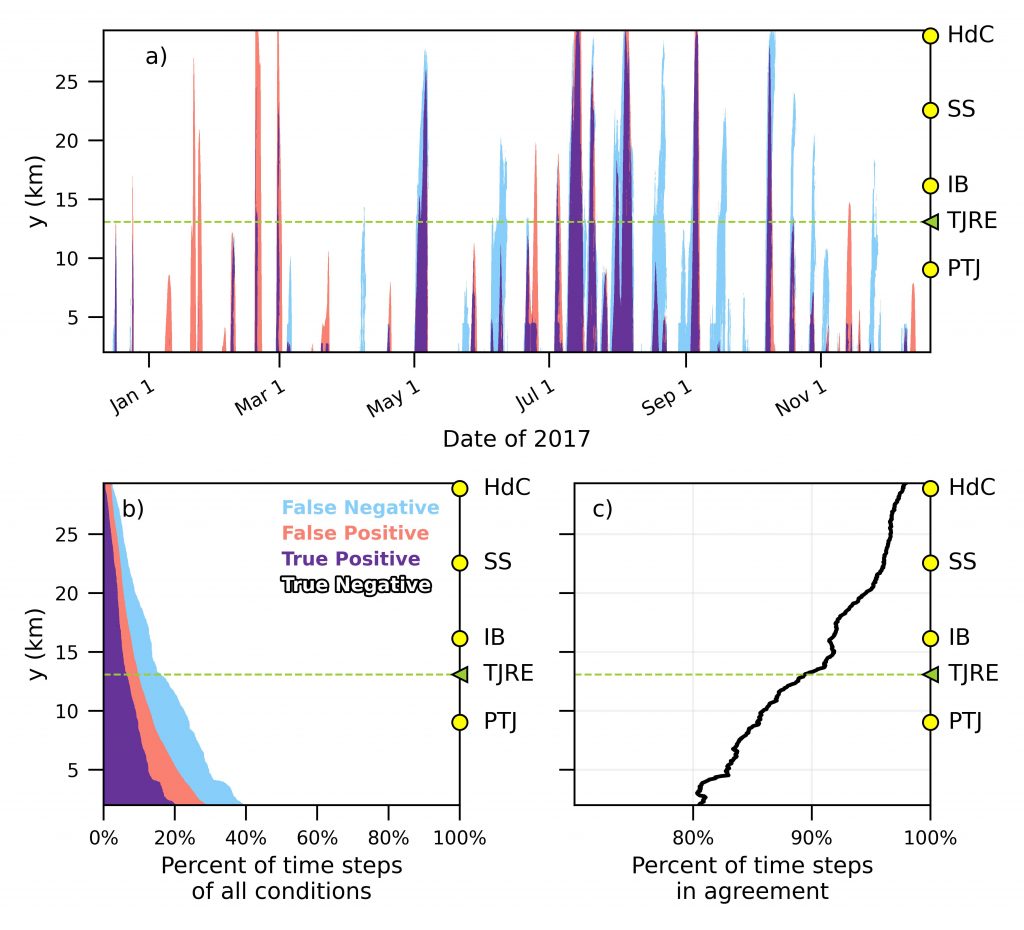
a) Time series comparing where hydrodynamic model dye exceeds 5×10⁻⁴ and where 1D model dye exceeds 5×10^-4 as a function of alongshore distance from the wastewater treatment plant for model year 2017. Four conditions are identified: False Negative (exceedance in hydrodynamic model, not in 1D model), False Positive (exceedance in 1D model, not in hydrodynamic model), True Positive (exceedance in both models), and True Negative (no exceedance in either model). Panel b) is a horizontally stacked bar plot of percentage of occurrences of the four conditions as a function of alongshore distance. Panel c) percent of all time steps that are True Positive or True Negative as a function of alongshore distance.
Agreement was defined as a time step where both models had concentrations above the cut off, or both below. Disagreement occurred when one model exceeded the cutoff and the other did not. The two models were found to be in agreement for 89% of all time steps at all locations! That is, water quality problems at the beach were predicted similarly between a state-of-the-art hydrodynamic model and a simple 1D model. This gives us the potential to translate wave observations and forecasts (readily available at wave buoys, Source) to make water quality predictions in the San Diego/Tijuana region.